1. What a trace is here
Four words, each with one meaning on this page, in the console, in the API and over MCP.
- Agent
- Something that does work without you watching: a coding assistant, a program with a model in its loop, a scheduled job. You register it once, or LastPing discovers it from its traces.
- Run
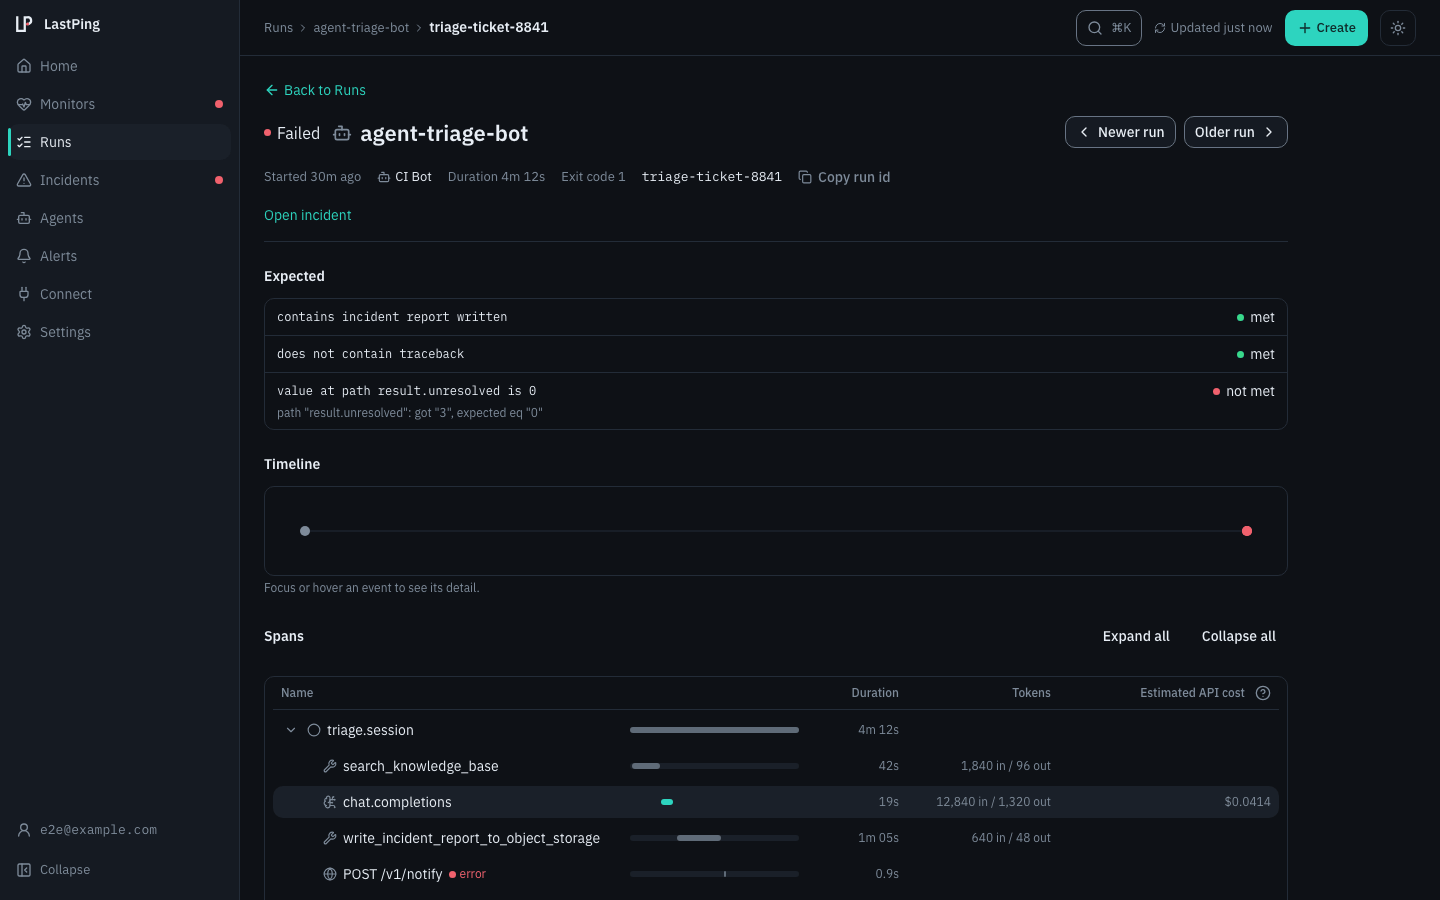
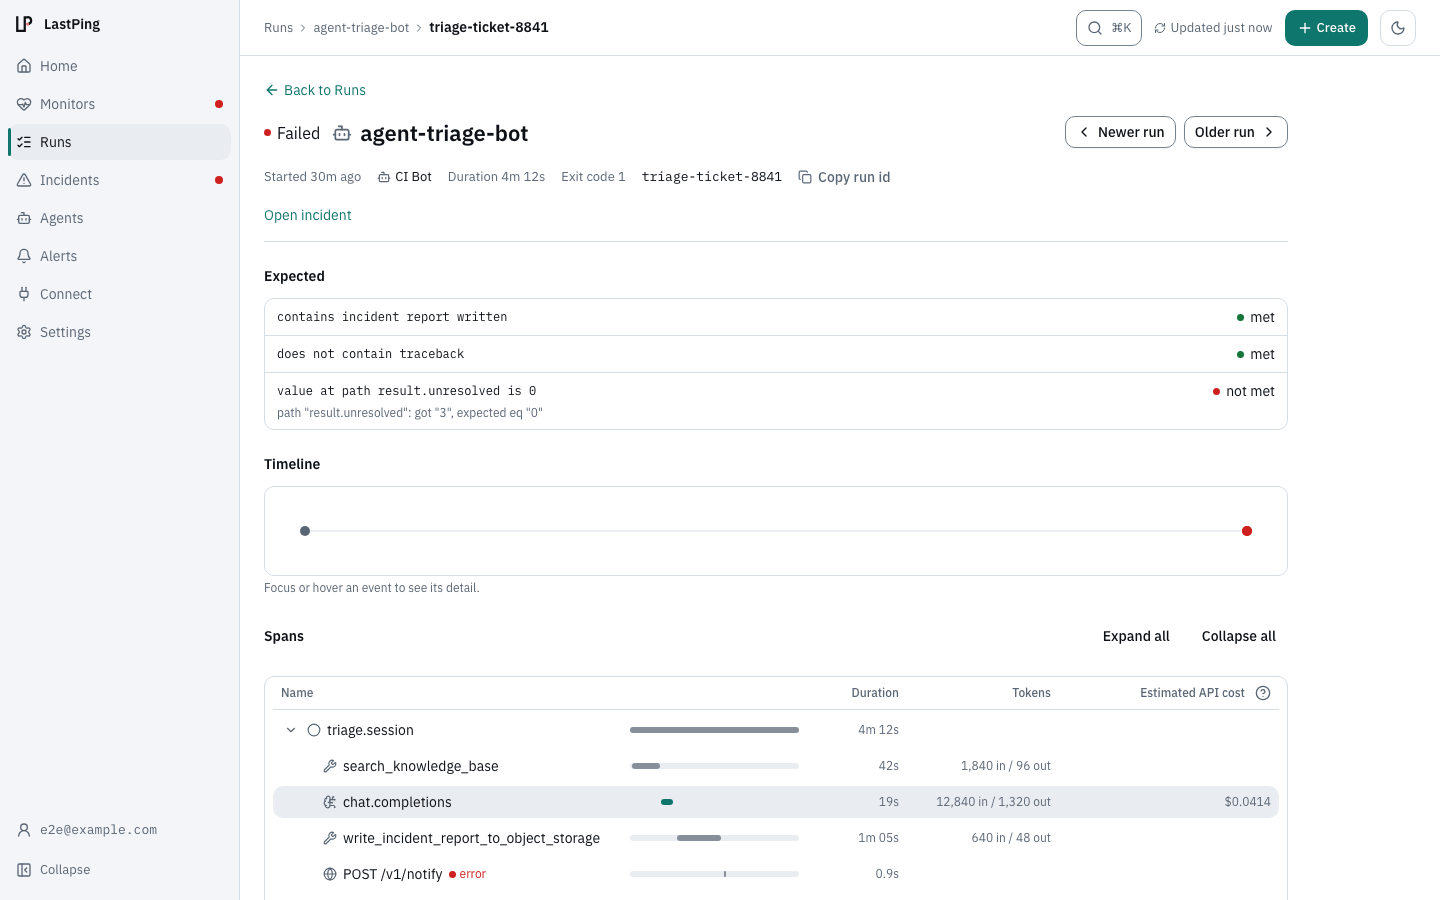
- One execution, on one of the agent's monitors: one job run, or one turn of an assistant. Runs are what the Runs page lists and what incidents are about.
- Trace
- One OpenTelemetry trace, known by its trace id. A run holds one trace or several. A trace never belongs to two runs.
- Span
- One timed step inside a trace: a model call, a tool call, an HTTP request, a database query.
Agent               registered, or discovered from its traces
└─ Monitor          the agent's monitor
   └─ Run           one execution
      └─ Trace      one trace id
         └─ Span    one timed step
Every span has exactly one home. A job with no agent starts the chain at its monitor.
Which run a trace joins
- If its resource attributes carry
lastping.run_id, it joins that run.lastping runsets this for the command it wraps. - If it carries an inbound
TRACEPARENTthat belongs to a run LastPing already knows, it joins that run. - Otherwise the trace becomes a run of its own. Nothing else is needed: an assistant that cannot mint a run id still produces runs.
A run made from a trace opens with its first span and closes when its root span ends. It reads Failed when any span reported an error, Succeeded once the root span has ended, Unfinished when it is still open after the monitor's maximum runtime, and Running before that. It appears on the Runs page like any other run, and it never opens an incident or pages anyone: detection still comes from pings.
Which agent a trace belongs to
LastPing reads the resource attribute service.name. That is the OpenTelemetry field's own
name; LastPing calls what it names a trace source. The Python, Node and Cursor set-ups below
set it with OTEL_SERVICE_NAME, the standard variable for that field.
- If it matches a registered agent's slug or name, ignoring case, the trace belongs to that agent. A slug match wins over a name match.
- If it matches nothing, LastPing records a discovered agent and lists it on the Agents page as unregistered, with one action to adopt it as a new agent or merge it into an existing one. Traces are never dropped because nobody registered first.
- With no
service.nameat all, the trace belongs to the monitor's agent, or to the monitor when it has none.
2. Set it up
You need a monitor for the agent and a tracing key for that monitor (see 7. Safety). Then there are four ways in, and the console offers them in this order.
- The prompt: the agent does it. A monitor's Connect page asks "What runs your agent?" and gives you a prompt to hand to that agent. The agent writes its own telemetry settings, keeps the key out of anything committed, sends one test span and tells you where it landed. For Claude Code and Codex the agent does not write those settings itself: it saves a set-up script that holds no key and asks you to read it and run it in the session, with
! sh ~/.lastping/setup-claude-code.shor! sh ~/.lastping/setup-codex.sh. The console opens with this way. - MCP: the assistant does it. An assistant already connected to LastPing over MCP calls
get_trace_setupwith the tool and the monitor and carries out the same steps. It never holds the tracing key: you create the key on the monitor's Connect page and store it from your own terminal. Over REST the same blocks are atGET /api/v1/checks/{id}/trace-setup. - One reviewed command: you run it. For Claude Code and Codex, the same set-up script without the prompt: you save it yourself from the console, read it, and run it with the tool's
!prefix, or in a terminal. The key never enters the chat: you store it first with one line in your own terminal, which asks for it at a hidden prompt. - By hand. The files, commands and variables below. This path is always there, so nobody is stuck.
| What runs your agent | What the set-up writes |
|---|---|
| Claude Code | The env block and otelHeadersHelper in ~/.claude/settings.json, a helper script that reads the key at run time, and a key file only you can read. |
| Codex CLI | The [otel] block in ~/.codex/config.toml, with the key in its headers, written by a set-up script you review and run. The key is in ~/.codex/config.toml, readable only by you (mode 600), and in a key file only you can read; nothing is added to your shell's start-up files. |
| Gemini CLI | The telemetry block in ~/.gemini/settings.json, pointed at this monitor's own URL. |
| Antigravity CLI | A hook script at ~/.lastping/agy-report.sh and a lastping hook group in ~/.gemini/config/hooks.json; the tracing key goes in ~/.lastping/agy/lastping-tracing-key. |
| Cursor | The opentelemetry-hooks runner registered in ~/.cursor/hooks.json, and its config file with the endpoint, key and monitor. |
| Python agent | Nothing in your code: the OpenTelemetry variables in .env, and opentelemetry-instrument in front of your start command. |
| Node agent | Nothing in your code: the OpenTelemetry variables in .env, and the register module in front of your start command. |
| Any OpenTelemetry SDK | Four environment variables: the endpoint, the protocol, the key header and the monitor id. |
| An OpenTelemetry Collector | One otlphttp exporter block in your collector's config, reading the key from LASTPING_TRACING_KEY, which .env gives the collector's environment. |
The files and commands, tool by tool
These are the blocks the console and get_trace_setup serve, with three placeholders:
<monitor id> is the monitor's id, <your tracing key> is the key, and
your-agent stands for the monitor's name. The endpoint is https://ping.lastping.dev.
- A file marked merge is a fragment: merge it into the file if it exists and keep every other key. Otherwise it is the whole file, and it is LastPing's own.
- A file marked mode 600 holds a credential. Make it private before anything goes into it, with
(umask 077; touch FILE) && chmod 600 FILE, never by writing first and changing the mode after. A file marked mode 700 is a script that holds no key. - Two steps that open with
# Either:and# Or, instead of the step above:are alternatives. Run one of them.
Claude Code
1. Store the key (in your own terminal, never in a chat)
sh -c '{ set +x; } 2>/dev/null; umask 077; trap "stty echo 2>/dev/null" EXIT; trap "exit 1" HUP INT TERM; printf "Paste the tracing key, then Enter: "; stty -echo 2>/dev/null; IFS= read -r k; stty echo 2>/dev/null; echo; case "$k" in lp_*) ;; *) echo "LastPing: that is not a tracing key (it starts with lp_). Nothing was changed." >&2; exit 1 ;; esac; if printf "%s" "$k" | LC_ALL=C grep -q "[^A-Za-z0-9_-]" || [ "${#k}" -lt 27 ] || [ "${#k}" -gt 200 ]; then echo "LastPing: that is not a tracing key. Nothing was changed." >&2; exit 1; fi; f="$HOME/.claude/lastping-tracing-key"; mkdir -p "$HOME/.claude" && touch "$f" && chmod 600 "$f" && printf "%s\n" "$k" > "$f" && echo saved'It asks for the key at a hidden prompt, so the key lands in neither a chat nor your shell's history, and prints saved. It runs in bash or zsh on macOS or Linux. In fish or PowerShell, do not paste it: put the key in with an editor instead.
2. Run the reviewed set-up script
The agent writes ~/.lastping/setup-claude-code.sh (mode 700), a script that holds no key. Read it, then run it with Claude Code's ! prefix, ! sh ~/.lastping/setup-claude-code.sh, or in a terminal. It merges the settings below into ~/.claude/settings.json and writes the helper script. It backs up what it changes, and a second run changes nothing. The agent never opens ~/.claude/settings.json, which can hold other tools' keys: the script checks it.
- If settings.json already sends telemetry somewhere else, the script changes nothing and exits 5. Settings that only change how the export is sent, such as OTEL_EXPORTER_OTLP_TIMEOUT or OTEL_EXPORTER_OTLP_COMPRESSION, are not a conflict and stay as they are.
- If it already sends Claude Code's telemetry to another LastPing monitor, the script names that monitor, changes nothing and exits 6. To move tracing to this monitor, run
! LASTPING_REPLACE=1 sh ~/.lastping/setup-claude-code.sh. To keep tracing on the other monitor, do not store this monitor's tracing key: there is one key file, so a key stored for this monitor stops the other monitor's traces until you store that monitor's own key again with its key line. - When python3 works and the LastPing hook reports to the same monitor, it also removes the LastPing reporting block from ~/.claude/CLAUDE.md, and from ./CLAUDE.md when that file is outside a git work tree. Otherwise it leaves the block where it is and tells you what to remove.
The files below are what it writes, for doing it by hand.
~/.claude/settings.json (merge)
{
  "env": {
    "CLAUDE_CODE_ENABLE_TELEMETRY": "1",
    "CLAUDE_CODE_ENHANCED_TELEMETRY_BETA": "1",
    "OTEL_TRACES_EXPORTER": "otlp",
    "OTEL_METRICS_EXPORTER": "otlp",
    "OTEL_LOGS_EXPORTER": "otlp",
    "OTEL_EXPORTER_OTLP_PROTOCOL": "http/protobuf",
    "OTEL_EXPORTER_OTLP_ENDPOINT": "https://ping.lastping.dev",
    "OTEL_RESOURCE_ATTRIBUTES": "lastping.monitor_id=<monitor id>",
    "OTEL_TRACES_EXPORT_INTERVAL": "15000",
    "OTEL_LOGS_EXPORT_INTERVAL": "15000"
  },
  "otelHeadersHelper": "~/.claude/lastping-otel-headers.sh"
}
~/.claude/lastping-otel-headers.sh (whole file, mode 700)
#!/bin/sh
# Prints the LastPing tracing key as an OTLP header for Claude Code, which
# runs this at start-up and about every 29 minutes. The key stays in its own
# file, so a new key takes effect without editing settings.json.
key=$(tr -d ' \r\n' < "$HOME/.claude/lastping-tracing-key" 2>/dev/null)
[ -n "$key" ] || exit 1
printf '{"Authorization":"Bearer %s"}\n' "$key"
~/.claude/lastping-tracing-key (whole file, mode 600)
<your tracing key>Or paste these by hand (the same settings as variables)
export CLAUDE_CODE_ENABLE_TELEMETRY="1"
export CLAUDE_CODE_ENHANCED_TELEMETRY_BETA="1"
export OTEL_TRACES_EXPORTER="otlp"
export OTEL_METRICS_EXPORTER="otlp"
export OTEL_LOGS_EXPORTER="otlp"
export OTEL_EXPORTER_OTLP_PROTOCOL="http/protobuf"
export OTEL_EXPORTER_OTLP_ENDPOINT="https://ping.lastping.dev"
export OTEL_RESOURCE_ATTRIBUTES="lastping.monitor_id=<monitor id>"
export OTEL_TRACES_EXPORT_INTERVAL="15000"
export OTEL_LOGS_EXPORT_INTERVAL="15000"
export OTEL_EXPORTER_OTLP_HEADERS="Authorization=Bearer $(tr -d ' \r\n' < "$HOME/.claude/lastping-tracing-key")"
The key header is for the one terminal the tool is started from, for that session only. Never put it in a shell profile, where every program that reads OTEL_EXPORTER_OTLP_HEADERS would send your key to its own endpoint.
Test span (must print 202)
now=$(date +%s)
tid=$(od -An -N16 -tx1 /dev/urandom | tr -d ' \n')
sid=$(od -An -N8 -tx1 /dev/urandom | tr -d ' \n')
{ printf 'Authorization: Bearer '; tr -d ' \r\n' < "$HOME/.claude/lastping-tracing-key"; printf '\n'; } |
curl -fsS -m 10 -o /dev/null -w '%{http_code}\n' -X POST "https://ping.lastping.dev/v1/traces" \
  -H "Content-Type: application/json" \
  -H @- \
  -d '{"resourceSpans":[{"resource":{"attributes":[{"key":"lastping.monitor_id","value":{"stringValue":"<monitor id>"}}]},"scopeSpans":[{"scope":{"name":"lastping-setup"},"spans":[{"traceId":"'"$tid"'","spanId":"'"$sid"'","name":"lastping test span","kind":1,"startTimeUnixNano":"'"$now"'000000000","endTimeUnixNano":"'"$now"'100000000","attributes":[{"key":"lastping.test","value":{"boolValue":true}}]}]}]}]}'
Then restart Claude Code once, because it reads these settings only when a session starts, and send it one message: that turn arrives as a run with its model calls and tool calls.
Codex CLI
The key goes into ~/.codex/config.toml, readable only by you (mode 600), and into ~/.codex/lastping-tracing-key (mode 600), where the set-up script reads it. Nothing is added to your shell's start-up files.
1. Store the key (in your own terminal, never in a chat)
sh -c '{ set +x; } 2>/dev/null; umask 077; trap "stty echo 2>/dev/null" EXIT; trap "exit 1" HUP INT TERM; printf "Paste the tracing key, then Enter: "; stty -echo 2>/dev/null; IFS= read -r k; stty echo 2>/dev/null; echo; case "$k" in lp_*) ;; *) echo "LastPing: that is not a tracing key (it starts with lp_). Nothing was changed." >&2; exit 1 ;; esac; if printf "%s" "$k" | LC_ALL=C grep -q "[^A-Za-z0-9_-]" || [ "${#k}" -lt 27 ] || [ "${#k}" -gt 200 ]; then echo "LastPing: that is not a tracing key. Nothing was changed." >&2; exit 1; fi; f="$HOME/.codex/lastping-tracing-key"; mkdir -p "$HOME/.codex" && touch "$f" && chmod 600 "$f" && printf "%s\n" "$k" > "$f" && echo saved'It asks for the key at a hidden prompt, so the key lands in neither a chat nor your shell's history, and prints saved. It runs in bash or zsh on macOS or Linux. In fish or PowerShell, do not paste it: put the key in with an editor instead.
2. Run the reviewed set-up script
The agent writes ~/.lastping/setup-codex.sh (mode 700), a script that holds no key; Codex asks for your approval, because its default sandbox lets a task write only inside its workspace and temporary folders. Read the script, then run it with Codex's ! prefix, ! sh ~/.lastping/setup-codex.sh, or, if that is refused, in a terminal. It writes the [otel] block below into ~/.codex/config.toml with the key you stored, which it reads with the shell's own read and never prints. It backs the file up to ~/.lastping/backups first, keeps every other line as it was, and leaves the file at mode 600. If the file already sends telemetry somewhere else, it changes nothing and says so; a second run changes nothing and says "already set".
~/.codex/config.toml (merge, mode 600)
[otel]
environment = "dev"
log_user_prompt = false
exporter = { otlp-http = { endpoint = "https://ping.lastping.dev/v1/logs", protocol = "binary", headers = { "Authorization" = "Bearer <your tracing key>" } } }
metrics_exporter = { otlp-http = { endpoint = "https://ping.lastping.dev/v1/metrics", protocol = "binary", headers = { "Authorization" = "Bearer <your tracing key>" } } }
trace_exporter = { otlp-http = { endpoint = "https://ping.lastping.dev/v1/traces", protocol = "binary", headers = { "Authorization" = "Bearer <your tracing key>" } } }
~/.codex/lastping-tracing-key (whole file, mode 600)
<your tracing key>By hand, merge the block into ~/.codex/config.toml with your key in place of the placeholder, then run chmod 600 ~/.codex/config.toml.
Check the file (prints 3, and nothing of the file)
grep -c 'https://ping.lastping.dev/v1/' ~/.codex/config.tomlTest span (must print 202)
now=$(date +%s)
tid=$(od -An -N16 -tx1 /dev/urandom | tr -d ' \n')
sid=$(od -An -N8 -tx1 /dev/urandom | tr -d ' \n')
{ printf 'Authorization: Bearer '; tr -d ' \r\n' < "$HOME/.codex/lastping-tracing-key"; printf '\n'; } |
curl -fsS -m 10 -o /dev/null -w '%{http_code}\n' -X POST "https://ping.lastping.dev/v1/traces" \
  -H "Content-Type: application/json" \
  -H @- \
  -d '{"resourceSpans":[{"resource":{"attributes":[{"key":"lastping.monitor_id","value":{"stringValue":"<monitor id>"}}]},"scopeSpans":[{"scope":{"name":"lastping-setup"},"spans":[{"traceId":"'"$tid"'","spanId":"'"$sid"'","name":"lastping test span","kind":1,"startTimeUnixNano":"'"$now"'000000000","endTimeUnixNano":"'"$now"'100000000","attributes":[{"key":"lastping.test","value":{"boolValue":true}}]}]}]}]}'
Then start a new Codex session and run one task: its token usage appears on this monitor. If an earlier LastPing set-up added a line that exports LASTPING_TRACING_KEY to your shell's start-up file (~/.zshrc, ~/.bashrc or similar), remove that line yourself: Codex no longer needs it, the script does not edit those files, and it hands the key to every program your shell starts. If you keep ~/.codex/config.toml in a dotfiles repository, keep that file out of git.
Gemini CLI
~/.gemini/settings.json (merge, mode 600)
{
  "telemetry": {
    "enabled": true,
    "target": "local",
    "traces": true,
    "otlpProtocol": "http",
    "otlpEndpoint": "https://ping.lastping.dev/<monitor id>",
    "logPrompts": false
  }
}
Or paste these by hand (the same settings as variables)
export GEMINI_TELEMETRY_ENABLED="true"
export GEMINI_TELEMETRY_TARGET="local"
export GEMINI_TELEMETRY_TRACES_ENABLED="true"
export GEMINI_TELEMETRY_OTLP_PROTOCOL="http"
export GEMINI_TELEMETRY_OTLP_ENDPOINT="https://ping.lastping.dev/<monitor id>"
export GEMINI_TELEMETRY_LOG_PROMPTS="false"
Test span (must print 202)
now=$(date +%s)
tid=$(od -An -N16 -tx1 /dev/urandom | tr -d ' \n')
sid=$(od -An -N8 -tx1 /dev/urandom | tr -d ' \n')
curl -fsS -m 10 -o /dev/null -w '%{http_code}\n' -X POST "https://ping.lastping.dev/<monitor id>/v1/traces" \
  -H "Content-Type: application/json" \
  -d '{"resourceSpans":[{"resource":{"attributes":[{"key":"lastping.monitor_id","value":{"stringValue":"<monitor id>"}}]},"scopeSpans":[{"scope":{"name":"lastping-setup"},"spans":[{"traceId":"'"$tid"'","spanId":"'"$sid"'","name":"lastping test span","kind":1,"startTimeUnixNano":"'"$now"'000000000","endTimeUnixNano":"'"$now"'100000000","attributes":[{"key":"lastping.test","value":{"boolValue":true}}]}]}]}]}'
Then start a new Gemini CLI session and send it one prompt: the turn arrives as a run with its model and tool calls.
Antigravity CLI
Antigravity CLI (agy) exports no telemetry itself. LastPing's hook script reports the runs and sends the spans. The tracing key goes in ~/.lastping/agy/lastping-tracing-key (mode 600), where the script reads it.
1. Install the hook (reports runs without any key)
An AI assistant connected to LastPing calls get_ping_instructions with the tool antigravity and carries out hook_install (over REST, GET /api/v1/checks/{id}/ping-instructions?hook_tool=antigravity), or use the monitor's Connect page: "What runs your agent?", then Antigravity CLI. It writes ~/.lastping/agy-report.sh and adds a hook group named lastping to ~/.gemini/config/hooks.json (PostToolUse, PostInvocation, Stop). Each agy turn becomes a run: started, a step per tool call, then success, or fail when agy's Stop reports an error.
2. Store the key (in your own terminal, never in a chat)
sh -c '{ set +x; } 2>/dev/null; umask 077; trap "stty echo 2>/dev/null" EXIT; trap "exit 1" HUP INT TERM; printf "Paste the tracing key, then Enter: "; stty -echo 2>/dev/null; IFS= read -r k; stty echo 2>/dev/null; echo; case "$k" in lp_*) ;; *) echo "LastPing: that is not a tracing key (it starts with lp_). Nothing was changed." >&2; exit 1 ;; esac; if printf "%s" "$k" | LC_ALL=C grep -q "[^A-Za-z0-9_-]" || [ "${#k}" -lt 27 ] || [ "${#k}" -gt 200 ]; then echo "LastPing: that is not a tracing key. Nothing was changed." >&2; exit 1; fi; f="$HOME/.lastping/agy/lastping-tracing-key"; mkdir -p "$HOME/.lastping/agy" && touch "$f" && chmod 600 "$f" && printf "%s\n" "$k" > "$f" && echo saved'Run this in a separate terminal window (Terminal, iTerm or your editor's terminal), not in Antigravity's chat and not as a ! command. It asks for the key at a hidden prompt, so the key never appears in the chat or your shell history. It prints saved. It runs in bash or zsh on macOS or Linux. In fish or PowerShell, do not paste it: put the key in with an editor instead.
What is written
- ~/.lastping/agy/lastping-tracing-key, the whole file is the key (mode 600).
- ~/.lastping/agy-report.sh, the hook script, and the lastping group in ~/.gemini/config/hooks.json.
There is one span per model call (chat <model>), one per tool call (execute_tool <tool>) and a root span per turn. No prompt or command text is sent.
Test span (must print 202)
now=$(date +%s)
tid=$(od -An -N16 -tx1 /dev/urandom | tr -d ' \n')
sid=$(od -An -N8 -tx1 /dev/urandom | tr -d ' \n')
{ printf 'Authorization: Bearer '; tr -d ' \r\n' < "$HOME/.lastping/agy/lastping-tracing-key"; printf '\n'; } |
curl -fsS -m 10 -o /dev/null -w '%{http_code}\n' -X POST "https://ping.lastping.dev/v1/traces" \
  -H "Content-Type: application/json" \
  -H @- \
  -d '{"resourceSpans":[{"resource":{"attributes":[{"key":"lastping.monitor_id","value":{"stringValue":"<monitor id>"}}]},"scopeSpans":[{"scope":{"name":"lastping-setup"},"spans":[{"traceId":"'"$tid"'","spanId":"'"$sid"'","name":"lastping test span","kind":1,"startTimeUnixNano":"'"$now"'000000000","endTimeUnixNano":"'"$now"'100000000","attributes":[{"key":"lastping.test","value":{"boolValue":true}}]}]}]}]}'
Spans start with the next Antigravity CLI turn after the key is stored, and nothing needs to be started again: the turn arrives as a run with its model and tool calls.
Limits: no token counts or cost, because Antigravity does not expose them. Span timing is approximate, because hooks fire after the fact, at one-second resolution. A run is never marked blocked, because there is no hook for waiting on a person. One Antigravity monitor per machine, because the key file is per user. The hook script needs a POSIX shell (macOS, Linux or WSL). Existing Gemini CLI installs keep using the Gemini CLI steps above.
Cursor
Run, in order
pipx install opentelemetry-hooks==0.14.0otel-hook setup --agent cursor~/.local/share/opentelemetry-hooks/otel_config.json (merge, mode 600)
{
  "OTEL_EXPORTER_OTLP_ENDPOINT": "https://ping.lastping.dev/v1/traces",
  "OTEL_EXPORTER_OTLP_PROTOCOL": "http/protobuf",
  "OTEL_EXPORTER_OTLP_HEADERS": "Authorization=Bearer <your tracing key>",
  "OTEL_RESOURCE_ATTRIBUTES": "lastping.monitor_id=<monitor id>",
  "OTEL_SERVICE_NAME": "cursor",
  "IDE_OTEL_CAPTURE_CONVERSATION_CONTENT": "false"
}
Or paste these by hand (the same settings as variables)
export OTEL_EXPORTER_OTLP_ENDPOINT="https://ping.lastping.dev/v1/traces"
export OTEL_EXPORTER_OTLP_PROTOCOL="http/protobuf"
export OTEL_RESOURCE_ATTRIBUTES="lastping.monitor_id=<monitor id>"
export OTEL_SERVICE_NAME="cursor"
Then paste this line on its own, after the lines above, and paste the key when it asks
lp_key=$(trap 'stty echo 2>/dev/null' EXIT; trap 'exit 130' INT TERM; printf 'Paste the tracing key, then Enter: ' >&2; stty -echo 2>/dev/null; IFS= read -r k || exit 1; printf '%s' "$k") && echo >&2 && export OTEL_EXPORTER_OTLP_HEADERS="Authorization=Bearer $lp_key"; unset lp_keyThe key header is for the one terminal the tool is started from, for that session only. Never put it in a shell profile, where every program that reads OTEL_EXPORTER_OTLP_HEADERS would send your key to its own endpoint.
Test span (must print 202)
key=$(sed -n 's/.*"Authorization=Bearer \([^"]*\)".*/\1/p' "$HOME/.local/share/opentelemetry-hooks/otel_config.json")
now=$(date +%s)
tid=$(od -An -N16 -tx1 /dev/urandom | tr -d ' \n')
sid=$(od -An -N8 -tx1 /dev/urandom | tr -d ' \n')
printf 'Authorization: %s\n' "Bearer $key" |
curl -fsS -m 10 -o /dev/null -w '%{http_code}\n' -X POST "https://ping.lastping.dev/v1/traces" \
  -H "Content-Type: application/json" \
  -H @- \
  -d '{"resourceSpans":[{"resource":{"attributes":[{"key":"lastping.monitor_id","value":{"stringValue":"<monitor id>"}}]},"scopeSpans":[{"scope":{"name":"lastping-setup"},"spans":[{"traceId":"'"$tid"'","spanId":"'"$sid"'","name":"lastping test span","kind":1,"startTimeUnixNano":"'"$now"'000000000","endTimeUnixNano":"'"$now"'100000000","attributes":[{"key":"lastping.test","value":{"boolValue":true}}]}]}]}]}'
Then restart Cursor and run one agent turn: it arrives as a run with its token counts and tool sequence.
Python agent
Before writing the key, check that .env is git ignored (git check-ignore .env prints .env); if it is not, add it to .gitignore first.
Run, in order
pip install opentelemetry-distro opentelemetry-exporter-otlp-proto-http opentelemetry-instrumentation-openai opentelemetry-instrumentation-anthropic opentelemetry-instrumentation-httpx opentelemetry-instrumentation-requests(cr=$(printf '\r'); while IFS= read -r l || [ -n "$l" ]; do l=${l%"$cr"}; case "$l" in OTEL_EXPORTER_OTLP_ENDPOINT=*|OTEL_EXPORTER_OTLP_PROTOCOL=*|OTEL_EXPORTER_OTLP_HEADERS=*|OTEL_RESOURCE_ATTRIBUTES=*|OTEL_SERVICE_NAME=*|OTEL_TRACES_EXPORTER=*|OTEL_METRICS_EXPORTER=*|OTEL_LOGS_EXPORTER=*|TRACELOOP_TRACE_CONTENT=*) v=${l#*=}; v=${v#\"}; v=${v%\"}; export "${l%%=*}=$v";; esac; done < .env; exec opentelemetry-instrument python agent.py).env (merge, mode 600)
OTEL_EXPORTER_OTLP_ENDPOINT="https://ping.lastping.dev"
OTEL_EXPORTER_OTLP_PROTOCOL="http/protobuf"
OTEL_EXPORTER_OTLP_HEADERS="Authorization=Bearer <your tracing key>"
OTEL_RESOURCE_ATTRIBUTES="lastping.monitor_id=<monitor id>"
OTEL_SERVICE_NAME="your-agent"
OTEL_TRACES_EXPORTER="otlp"
OTEL_METRICS_EXPORTER="none"
OTEL_LOGS_EXPORTER="none"
TRACELOOP_TRACE_CONTENT="false"
Or paste these by hand (the same settings as variables)
export OTEL_EXPORTER_OTLP_ENDPOINT="https://ping.lastping.dev"
export OTEL_EXPORTER_OTLP_PROTOCOL="http/protobuf"
export OTEL_RESOURCE_ATTRIBUTES="lastping.monitor_id=<monitor id>"
export OTEL_SERVICE_NAME="your-agent"
export OTEL_TRACES_EXPORTER="otlp"
export OTEL_METRICS_EXPORTER="none"
export OTEL_LOGS_EXPORTER="none"
export TRACELOOP_TRACE_CONTENT="false"
Then paste this line on its own, after the lines above, and paste the key when it asks
lp_key=$(trap 'stty echo 2>/dev/null' EXIT; trap 'exit 130' INT TERM; printf 'Paste the tracing key, then Enter: ' >&2; stty -echo 2>/dev/null; IFS= read -r k || exit 1; printf '%s' "$k") && echo >&2 && export OTEL_EXPORTER_OTLP_HEADERS="Authorization=Bearer $lp_key"; unset lp_keyThe key header is for the one terminal the tool is started from, for that session only. Never put it in a shell profile, where every program that reads OTEL_EXPORTER_OTLP_HEADERS would send your key to its own endpoint.
Test span (must print 202)
auth=$(sed -n 's/^OTEL_EXPORTER_OTLP_HEADERS="*\([^"]*\).*/\1/p' .env | tr -d '\r' | tail -n 1)
now=$(date +%s)
tid=$(od -An -N16 -tx1 /dev/urandom | tr -d ' \n')
sid=$(od -An -N8 -tx1 /dev/urandom | tr -d ' \n')
printf 'Authorization: %s\n' "${auth#Authorization=}" |
curl -fsS -m 10 -o /dev/null -w '%{http_code}\n' -X POST "https://ping.lastping.dev/v1/traces" \
  -H "Content-Type: application/json" \
  -H @- \
  -d '{"resourceSpans":[{"resource":{"attributes":[{"key":"lastping.monitor_id","value":{"stringValue":"<monitor id>"}}]},"scopeSpans":[{"scope":{"name":"lastping-setup"},"spans":[{"traceId":"'"$tid"'","spanId":"'"$sid"'","name":"lastping test span","kind":1,"startTimeUnixNano":"'"$now"'000000000","endTimeUnixNano":"'"$now"'100000000","attributes":[{"key":"lastping.test","value":{"boolValue":true}}]}]}]}]}'
Then start the agent with the new command and let it make one model call: that call arrives as a span with its model and token counts.
Node agent
Before writing the key, check that .env is git ignored (git check-ignore .env prints .env); if it is not, add it to .gitignore first.
Run, in order
npm install @opentelemetry/api @opentelemetry/instrumentation @opentelemetry/auto-instrumentations-node# Either: a CommonJS project
node --env-file=.env --require @opentelemetry/auto-instrumentations-node/register agent.js# Or, instead of the step above: an ES module project
node --env-file=.env --experimental-loader=@opentelemetry/instrumentation/hook.mjs --import @opentelemetry/auto-instrumentations-node/register agent.mjs.env (merge, mode 600)
OTEL_EXPORTER_OTLP_ENDPOINT="https://ping.lastping.dev"
OTEL_EXPORTER_OTLP_PROTOCOL="http/protobuf"
OTEL_EXPORTER_OTLP_HEADERS="Authorization=Bearer <your tracing key>"
OTEL_RESOURCE_ATTRIBUTES="lastping.monitor_id=<monitor id>"
OTEL_SERVICE_NAME="your-agent"
OTEL_TRACES_EXPORTER="otlp"
OTEL_METRICS_EXPORTER="none"
OTEL_LOGS_EXPORTER="none"
OTEL_NODE_RESOURCE_DETECTORS="env,host,os"
Or paste these by hand (the same settings as variables)
export OTEL_EXPORTER_OTLP_ENDPOINT="https://ping.lastping.dev"
export OTEL_EXPORTER_OTLP_PROTOCOL="http/protobuf"
export OTEL_RESOURCE_ATTRIBUTES="lastping.monitor_id=<monitor id>"
export OTEL_SERVICE_NAME="your-agent"
export OTEL_TRACES_EXPORTER="otlp"
export OTEL_METRICS_EXPORTER="none"
export OTEL_LOGS_EXPORTER="none"
export OTEL_NODE_RESOURCE_DETECTORS="env,host,os"
Then paste this line on its own, after the lines above, and paste the key when it asks
lp_key=$(trap 'stty echo 2>/dev/null' EXIT; trap 'exit 130' INT TERM; printf 'Paste the tracing key, then Enter: ' >&2; stty -echo 2>/dev/null; IFS= read -r k || exit 1; printf '%s' "$k") && echo >&2 && export OTEL_EXPORTER_OTLP_HEADERS="Authorization=Bearer $lp_key"; unset lp_keyThe key header is for the one terminal the tool is started from, for that session only. Never put it in a shell profile, where every program that reads OTEL_EXPORTER_OTLP_HEADERS would send your key to its own endpoint.
Test span (must print 202)
auth=$(sed -n 's/^OTEL_EXPORTER_OTLP_HEADERS="*\([^"]*\).*/\1/p' .env | tr -d '\r' | tail -n 1)
now=$(date +%s)
tid=$(od -An -N16 -tx1 /dev/urandom | tr -d ' \n')
sid=$(od -An -N8 -tx1 /dev/urandom | tr -d ' \n')
printf 'Authorization: %s\n' "${auth#Authorization=}" |
curl -fsS -m 10 -o /dev/null -w '%{http_code}\n' -X POST "https://ping.lastping.dev/v1/traces" \
  -H "Content-Type: application/json" \
  -H @- \
  -d '{"resourceSpans":[{"resource":{"attributes":[{"key":"lastping.monitor_id","value":{"stringValue":"<monitor id>"}}]},"scopeSpans":[{"scope":{"name":"lastping-setup"},"spans":[{"traceId":"'"$tid"'","spanId":"'"$sid"'","name":"lastping test span","kind":1,"startTimeUnixNano":"'"$now"'000000000","endTimeUnixNano":"'"$now"'100000000","attributes":[{"key":"lastping.test","value":{"boolValue":true}}]}]}]}]}'
Then start the agent with the line for its module type and let it make one model call: that call arrives as a span with its model and token counts.
Any OpenTelemetry SDK
Before writing the key, check that .env is git ignored (git check-ignore .env prints .env); if it is not, add it to .gitignore first.
.env (merge, mode 600)
OTEL_EXPORTER_OTLP_ENDPOINT="https://ping.lastping.dev"
OTEL_EXPORTER_OTLP_PROTOCOL="http/protobuf"
OTEL_EXPORTER_OTLP_HEADERS="Authorization=Bearer <your tracing key>"
OTEL_RESOURCE_ATTRIBUTES="lastping.monitor_id=<monitor id>"
Or paste these by hand (the same settings as variables)
export OTEL_EXPORTER_OTLP_ENDPOINT="https://ping.lastping.dev"
export OTEL_EXPORTER_OTLP_PROTOCOL="http/protobuf"
export OTEL_RESOURCE_ATTRIBUTES="lastping.monitor_id=<monitor id>"
Then paste this line on its own, after the lines above, and paste the key when it asks
lp_key=$(trap 'stty echo 2>/dev/null' EXIT; trap 'exit 130' INT TERM; printf 'Paste the tracing key, then Enter: ' >&2; stty -echo 2>/dev/null; IFS= read -r k || exit 1; printf '%s' "$k") && echo >&2 && export OTEL_EXPORTER_OTLP_HEADERS="Authorization=Bearer $lp_key"; unset lp_keyThe key header is for the one terminal the tool is started from, for that session only. Never put it in a shell profile, where every program that reads OTEL_EXPORTER_OTLP_HEADERS would send your key to its own endpoint.
Test span (must print 202)
auth=$(sed -n 's/^OTEL_EXPORTER_OTLP_HEADERS="*\([^"]*\).*/\1/p' .env | tr -d '\r' | tail -n 1)
now=$(date +%s)
tid=$(od -An -N16 -tx1 /dev/urandom | tr -d ' \n')
sid=$(od -An -N8 -tx1 /dev/urandom | tr -d ' \n')
printf 'Authorization: %s\n' "${auth#Authorization=}" |
curl -fsS -m 10 -o /dev/null -w '%{http_code}\n' -X POST "https://ping.lastping.dev/v1/traces" \
  -H "Content-Type: application/json" \
  -H @- \
  -d '{"resourceSpans":[{"resource":{"attributes":[{"key":"lastping.monitor_id","value":{"stringValue":"<monitor id>"}}]},"scopeSpans":[{"scope":{"name":"lastping-setup"},"spans":[{"traceId":"'"$tid"'","spanId":"'"$sid"'","name":"lastping test span","kind":1,"startTimeUnixNano":"'"$now"'000000000","endTimeUnixNano":"'"$now"'100000000","attributes":[{"key":"lastping.test","value":{"boolValue":true}}]}]}]}]}'
Then start your program with these variables in its environment, through your framework's own .env loading or, in a shell, with this line, which reads only these variables from .env and runs nothing in it:
(cr=$(printf '\r'); while IFS= read -r l || [ -n "$l" ]; do l=${l%"$cr"}; case "$l" in OTEL_EXPORTER_OTLP_ENDPOINT=*|OTEL_EXPORTER_OTLP_PROTOCOL=*|OTEL_EXPORTER_OTLP_HEADERS=*|OTEL_RESOURCE_ATTRIBUTES=*) v=${l#*=}; v=${v#\"}; v=${v%\"}; export "${l%%=*}=$v";; esac; done < .env; exec your-start-command)Its spans arrive on this monitor.
An OpenTelemetry Collector
Before writing the key, check that .env is git ignored (git check-ignore .env prints .env); if it is not, add it to .gitignore first.
Run, in order
# Either: the collector installed on this machine
LASTPING_TRACING_KEY="$(sed -n 's/^LASTPING_TRACING_KEY="*\([^"]*\).*/\1/p' .env | tr -d '\r' | tail -n 1)" otelcol --config otelcol-config.yaml
# Or, instead of the step above: the collector in docker
LASTPING_TRACING_KEY="$(sed -n 's/^LASTPING_TRACING_KEY="*\([^"]*\).*/\1/p' .env | tr -d '\r' | tail -n 1)" docker run --rm -p 4317:4317 -p 4318:4318 -e LASTPING_TRACING_KEY -v "$PWD/otelcol-config.yaml:/etc/otelcol/config.yaml:ro" otel/opentelemetry-collector --config /etc/otelcol/config.yamlotelcol-config.yaml (merge)
exporters:
  otlphttp/lastping:
    endpoint: https://ping.lastping.dev
    headers:
      Authorization: "Bearer ${env:LASTPING_TRACING_KEY}"

# Add otlphttp/lastping to the exporters of the pipelines that carry
# this agent's telemetry, for example:
service:
  pipelines:
    traces:
      receivers: [otlp]
      exporters: [otlphttp/lastping]
.env (merge, mode 600)
LASTPING_TRACING_KEY="<your tracing key>"Or paste this by hand (it asks for the key at a hidden prompt)
lp_key=$(trap 'stty echo 2>/dev/null' EXIT; trap 'exit 130' INT TERM; printf 'Paste the tracing key, then Enter: ' >&2; stty -echo 2>/dev/null; IFS= read -r k || exit 1; printf '%s' "$k") && echo >&2 && export LASTPING_TRACING_KEY="$lp_key"; unset lp_keyTest span (must print 202)
key=$(sed -n 's/^LASTPING_TRACING_KEY="*\([^"]*\).*/\1/p' .env | tr -d '\r' | tail -n 1)
now=$(date +%s)
tid=$(od -An -N16 -tx1 /dev/urandom | tr -d ' \n')
sid=$(od -An -N8 -tx1 /dev/urandom | tr -d ' \n')
printf 'Authorization: %s\n' "Bearer $key" |
curl -fsS -m 10 -o /dev/null -w '%{http_code}\n' -X POST "https://ping.lastping.dev/v1/traces" \
  -H "Content-Type: application/json" \
  -H @- \
  -d '{"resourceSpans":[{"resource":{"attributes":[{"key":"lastping.monitor_id","value":{"stringValue":"<monitor id>"}}]},"scopeSpans":[{"scope":{"name":"lastping-setup"},"spans":[{"traceId":"'"$tid"'","spanId":"'"$sid"'","name":"lastping test span","kind":1,"startTimeUnixNano":"'"$now"'000000000","endTimeUnixNano":"'"$now"'100000000","attributes":[{"key":"lastping.test","value":{"boolValue":true}}]}]}]}]}'
Then restart the collector with the key from .env in its environment, as the start line above does: what it forwards arrives on this monitor.
The test span
Every block ends by sending one test span, and it must print 202. Within a minute one run
titled "LastPing test span" appears on the monitor's runs. The span carries lastping.test=true,
so that run is marked as a test and left out of every count and total, Home's included. Any other answer is
the reason nothing will arrive:
401: a wrong or expired key.403: a key that cannot send telemetry.400: a key bound to a different monitor.404: an unknown monitor.429: a rate or daily budget limit (see 8. Limits).
When a test span passes and real traces still do not arrive, the monitor's trace diagnostics list the
latest ingest attempts and the reason each one was refused: in the console, over MCP with
get_trace_diagnostics, or at GET /api/v1/checks/{id}/trace-diagnostics.
An export sent over gRPC never reaches LastPing at all, so it cannot appear there.
3. What LastPing understands
You do not need a translation layer. LastPing recognises the attribute vocabulary a span speaks and reads the same five facts from each: the provider, the model, the tokens, the tool and the operation.
| Vocabulary | Who sends it | What LastPing reads |
|---|---|---|
| OpenTelemetry GenAI conventions, current and older names | Most model instrumentations and SDKs | Provider from gen_ai.provider.name or gen_ai.system; model from gen_ai.request.model, else gen_ai.response.model; tokens from gen_ai.usage.input_tokens and gen_ai.usage.output_tokens, or the older prompt_tokens and completion_tokens; cache reads and writes from gen_ai.usage.cache_read.input_tokens and gen_ai.usage.cache_creation.input_tokens; the tool from gen_ai.tool.name; the operation from gen_ai.operation.name. |
| OpenLLMetry (Traceloop) | The OpenAI and Anthropic instrumentations the Python set-up installs | The GenAI keys above, plus its own cache spelling gen_ai.usage.cache_read_input_tokens and gen_ai.usage.cache_creation_input_tokens. |
| OpenInference (Arize) | OpenInference instrumentations | Provider from llm.system or llm.provider; model from llm.model_name; tokens from llm.token_count.prompt and llm.token_count.completion and their cache details; a cost from llm.cost.total; the tool from tool.name on a TOOL span. |
| Claude Code | Claude Code's own export (claude_code.* spans) |
Its bare keys: model, input_tokens, output_tokens, cache_read_tokens, cache_creation_tokens and tool_name. |
| Gemini CLI and the Cursor hook runner | Gemini CLI's own export, and the opentelemetry-hooks runner | The GenAI keys, recognised by each emitter's own marker so their tool calls are read as tool calls. |
Provider names are lower-cased, so OpenAI and openai are one dependency. Tool names
pass through one mapping table, so the same action is one word whichever tool took it; a name the table does
not know passes through unchanged.
| Shown as | Sent as |
|---|---|
shell |
bash, Bash, run_shell_command, shell, terminal, run_terminal_cmd |
read_file |
Read, read_file, ReadFile |
write_file |
Write, write_file |
edit_file |
Edit, edit_file, apply_patch |
find_files |
Glob |
search_files |
Grep, grep |
web_search |
WebSearch, google_web_search |
web_fetch |
WebFetch, web_fetch |
subagent |
Task, Agent |
Metrics and log events
Some tools report usage without traces, so /v1/metrics and /v1/logs are accepted too.
LastPing keeps six metric families and turns them into daily token and cost totals per model:
claude_code.token.usage, claude_code.cost.usage, gemini_cli.token.usage,
gen_ai.client.token.usage, cursor.token.usage and cursor.cost.usage.
Only delta temporality is summed; a cumulative data point is dropped and recorded in the diagnostics rather
than turned into a wrong number. Other metric families are dropped.
Of log records, LastPing keeps the events that describe a turn: Claude Code's user_prompt,
assistant_response, tool_result, tool_decision, api_request and
api_error; Codex's documented events; and Cursor's error and correction events. Other events are
counted and discarded.
Where a tool sends spans and metrics for the same calls, the two are never added together: for one day, provider and model, the numbers from traces win.
4. Tokens and cost
No OpenTelemetry convention defines a cost, so LastPing keeps a price table and computes one. What you see is labelled for what it is.
Input tokens include the cache
LastPing follows the OpenTelemetry inclusive rule: a call's input tokens are the whole prompt, cache reads and cache writes included, and the cache counts are a split of that number, never added again. The GenAI conventions and OpenInference already send tokens this way. Claude Code sends the uncached remainder, the way the Anthropic API reports it, so LastPing adds its cache reads and writes back to reach the same meaning.
How a cost is computed
uncached = input tokens - cache reads - cache writes
cost     = uncached    x input rate
         + cache reads x cache read rate
         + cache writes x cache write rate
         + output tokens x output rate
Rates are US dollars per million tokens, the standard rate on each provider's own pricing page. A model with no cache read rate is charged at its input rate for reads. A model with no separate cache write rate keeps its writes in the uncached input, charged at the input rate, never free. Tokens and cost are counted on model calls only, so an agent span that repeats its children's usage is not counted twice.
What "estimated" means
- A span that carries its own cost, in
gen_ai.usage.costor OpenInference'sllm.cost.total, keeps that figure, and it wins over LastPing's. - Claude Code prices each model call itself and logs that figure on its
api_requestevent. LastPing attaches it to the matching call (same session and model, inside the call's time span, one to one), and it wins over LastPing's estimate. A call with no single match keeps the estimate. - A cost LastPing computed from the table is an estimate. Every total says what it is made of: API cost when every priced call's figure came from the client, Estimated API cost when LastPing priced them all, and API cost (partly estimated) when a total mixes both.
- A usage row built from a tool's own cost metric (Claude Code's cost metric, or Cursor's best-effort figure) is that tool's figure and is not labelled estimated.
- When no call could be priced, there is no cost at all. An unknown model never shows
$0, and a provider LastPing does not recognise (a reseller or a proxy) is never priced at the model maker's rate.
Some prices depend on what OTLP does not say. OpenAI and Google charge more above a long-context threshold; the table stores the lower tier, so a long-context call reads low. Anthropic's one-hour cache writes cost more than five-minute ones; the table stores the five-minute rate. The label "estimated" is what keeps those numbers honest.
The price table (62 rows, read on 2026-09-24)
USD per million tokens. "Input rate" means the row has no separate price and that column is charged at the input rate. A row with a later "from" date takes over on that day. Each row's source is its provider's own pricing page: Anthropic, OpenAI and Google.
| Model | Input | Output | Cache read | Cache write | From |
|---|---|---|---|---|---|
| Anthropic | |||||
claude-fable-5-1 | 10 | 50 | 0.25 | 12.50 | 2026-09-24 |
claude-mythos-5-1 | 10 | 50 | 0.25 | 12.50 | 2026-09-24 |
claude-fable-5 | 10 | 50 | 1 | 12.50 | 2026-09-24 |
claude-mythos-5 | 10 | 50 | 1 | 12.50 | 2026-09-24 |
claude-opus-5-5 | 4 | 20 | 0.20 | 5 | 2026-09-24 |
claude-opus-5 | 5 | 25 | 0.50 | 6.25 | 2026-09-24 |
claude-opus-4-8 | 5 | 25 | 0.50 | 6.25 | 2026-09-24 |
claude-opus-4-7 | 5 | 25 | 0.50 | 6.25 | 2026-09-24 |
claude-opus-4-6 | 5 | 25 | 0.50 | 6.25 | 2026-09-24 |
claude-opus-4-5 | 5 | 25 | 0.50 | 6.25 | 2026-09-24 |
claude-opus-4-1 | 15 | 75 | 1.50 | 18.75 | 2026-09-24 |
claude-opus-4 | 15 | 75 | 1.50 | 18.75 | 2026-09-24 |
claude-sonnet-5 | 2 | 10 | 0.20 | 2.50 | 2026-09-24 |
claude-sonnet-4-6 | 3 | 15 | 0.30 | 3.75 | 2026-09-24 |
claude-sonnet-4-5 | 3 | 15 | 0.30 | 3.75 | 2026-09-24 |
claude-sonnet-4 | 3 | 15 | 0.30 | 3.75 | 2026-09-24 |
claude-haiku-4-5 | 1 | 5 | 0.10 | 1.25 | 2026-09-24 |
claude-3-5-haiku | 0.80 | 4 | 0.08 | 1 | 2026-09-24 |
| OpenAI | |||||
gpt-6-astra | 10 | 50 | 1 | 12.50 | 2026-09-24 |
gpt-6-sol | 2 | 10 | 0.20 | 2.50 | 2026-09-24 |
gpt-6-luna | 0.10 | 0.50 | 0.01 | 0.125 | 2026-09-24 |
gpt-5.6-sol | 4 | 20 | 0.40 | 5 | 2026-09-24 |
gpt-5.6-terra | 2 | 12 | 0.20 | 2.50 | 2026-09-24 |
gpt-5.6-luna | 0.20 | 1.20 | 0.02 | 0.25 | 2026-09-24 |
gpt-5.5 | 5 | 30 | 0.50 | input rate | 2026-09-24 |
gpt-5.5-pro | 30 | 180 | input rate | input rate | 2026-09-24 |
gpt-5.4 | 2.50 | 15 | 0.25 | input rate | 2026-09-24 |
gpt-5.4-mini | 0.75 | 4.50 | 0.075 | input rate | 2026-09-24 |
gpt-5.4-nano | 0.20 | 1.25 | 0.02 | input rate | 2026-09-24 |
gpt-5.4-pro | 30 | 180 | input rate | input rate | 2026-09-24 |
gpt-5.2 | 1.75 | 14 | 0.175 | input rate | 2026-09-24 |
gpt-5.2-pro | 21 | 168 | input rate | input rate | 2026-09-24 |
gpt-5.1 | 1.25 | 10 | 0.125 | input rate | 2026-09-24 |
gpt-5 | 1.25 | 10 | 0.125 | input rate | 2026-09-24 |
gpt-5-mini | 0.25 | 2 | 0.025 | input rate | 2026-09-24 |
gpt-5-nano | 0.05 | 0.40 | 0.005 | input rate | 2026-09-24 |
gpt-5-pro | 15 | 120 | input rate | input rate | 2026-09-24 |
gpt-4.1 | 2 | 8 | 0.50 | input rate | 2026-09-24 |
gpt-4.1-mini | 0.40 | 1.60 | 0.10 | input rate | 2026-09-24 |
gpt-4.1-nano | 0.10 | 0.40 | 0.025 | input rate | 2026-09-24 |
gpt-4o | 2.50 | 10 | 1.25 | input rate | 2026-09-24 |
gpt-4o-2024-05-13 | 5 | 15 | input rate | input rate | 2026-09-24 |
gpt-4o-mini | 0.15 | 0.60 | 0.075 | input rate | 2026-09-24 |
o1 | 15 | 60 | 7.50 | input rate | 2026-09-24 |
o1-pro | 150 | 600 | input rate | input rate | 2026-09-24 |
o3-pro | 20 | 80 | input rate | input rate | 2026-09-24 |
o3 | 2 | 8 | 0.50 | input rate | 2026-09-24 |
o4-mini | 1.10 | 4.40 | 0.275 | input rate | 2026-09-24 |
o3-mini | 1.10 | 4.40 | 0.55 | input rate | 2026-09-24 |
gemini-3.8-flash | 0.75 | 3.75 | 0.075 | input rate | 2026-09-24 |
gemini-3.8-flash | 1.50 | 7.50 | 0.15 | input rate | 2027-01-01 |
gemini-3.7-flash | 0.75 | 3.75 | 0.075 | input rate | 2026-09-24 |
gemini-3.7-flash | 1.50 | 7.50 | 0.15 | input rate | 2027-01-01 |
gemini-3.6-flash | 0.75 | 3.75 | 0.075 | input rate | 2026-09-24 |
gemini-3.6-flash | 1.50 | 7.50 | 0.15 | input rate | 2027-01-01 |
gemini-3.5-flash | 1.50 | 9 | 0.15 | input rate | 2026-09-24 |
gemini-3.5-flash-lite | 0.30 | 2.50 | 0.03 | input rate | 2026-09-24 |
gemini-3.1-flash-lite | 0.25 | 1.50 | 0.025 | input rate | 2026-09-24 |
gemini-3.1-pro-preview | 2 | 12 | 0.20 | input rate | 2026-09-24 |
gemini-2.5-pro | 1.25 | 10 | 0.125 | input rate | 2026-09-24 |
gemini-2.5-flash | 0.30 | 2.50 | 0.03 | input rate | 2026-09-24 |
gemini-2.5-flash-lite | 0.10 | 0.40 | 0.01 | input rate | 2026-09-24 |
5. Dependencies
What an agent calls is worked out from each span at ingest, with no configuration. The rules are tried in this order, so a span with evidence for two kinds always lands on the same one.
| Kind | Span evidence | Name shown |
|---|---|---|
| model | A GenAI span naming a provider or a model, that is not itself a tool call or an agent invocation | Provider and model, e.g. anthropic claude-sonnet-5 |
| tool | A tool name in the span, or a span named execute_tool <name> or tool.<name> |
The mapped tool name |
| database | db.system or db.system.name |
The system plus db.namespace, db.name or server.address, e.g. postgresql orders |
| queue | messaging.system |
The system plus the destination, e.g. rabbitmq jobs |
| rpc | rpc.service or rpc.system |
What was called |
| http | A client span with server.address, url.full, http.url or net.peer.name |
The host only: never a path, a query or credentials |
Every other span is an internal step: it stays in the run's waterfall and is not a dependency. Incoming calls
are counted too: a server span that names its caller in client.address, and a server or consumer
span that names the broker in messaging.system.
What the map shows
An agent's Overview in the console reads a daily aggregate of those calls, so it stays fast however many spans arrive.
- Dependencies: the agent in the centre and what it calls around it. Edge width is calls. Edge colour is error rate: grey up to 1%, amber above 1%, red above 5%. Each dependency is a button that filters the calls table.
- Calls: each dependency with its calls, errors, p50 and p95 latency, tokens and API cost. Latency comes from fixed buckets, so p95 is a bucket ceiling, and a p95 over 60 seconds is shown as over 60 seconds.
- Tokens and cost: per model per day, with the costliest runs.
- Errors: failed calls grouped by target and message, linked to their runs.
Every dependency and calls row opens the Runs page's Traced view already filtered. That view
filters by agent, dependency, operation, model, error, minimum duration and minimum cost, finds a run
by its trace id, and keeps its filters in the URL. Across the whole project, "everything that calls postgres"
is list_dependencies over MCP or GET /api/v1/dependencies; one agent's is
get_agent_dependencies or GET /api/v1/agents/{id}/dependencies.
6. What each tool cannot do
Read this before you open a ticket. Each line is a property of the tool, not something a setting on our side
can change, and the console and get_trace_setup say the same.
- Claude Code
- Claude Code reports tokens under its own names (input_tokens, output_tokens, cache_read_tokens, cache_creation_tokens), not the GenAI conventions' names, and its input_tokens leaves the cache out. LastPing reads those names and adds the cache back, so its numbers mean the same as every other tool's. Claude Code reads telemetry settings only when a session starts, so a running session needs one restart. An interactive session ignores an inbound TRACEPARENT, so each turn is its own run. With LastPing's Claude Code hook installed too, the hook's start ping carries the session id and the project (the folder's name, never its path), and LastPing joins that turn's traces to the hook's run: one turn is one run, not two. If the hook was installed before this release, re-run the Claude Code set-up once. Prompt text leaves Claude Code only if OTEL_LOG_USER_PROMPTS is set, and this set-up does not set it. The env block is user-level, so these variables may also reach programs Claude Code starts, and one of those that uses OpenTelemetry may then send its own telemetry to this monitor. The hooks and set-up scripts are POSIX sh: on Windows, run them in WSL or Git Bash. They are untested on Windows.
- Codex CLI
- Codex's documented signal is logs: events with model, token counts and tool decisions. Its span names and attributes are not documented, so what LastPing shows for Codex today is usage and events, not a waterfall. Codex cannot set resource attributes, so the key must be bound to this monitor, which a tracing key minted for this monitor is. Codex reads config.toml when it starts, so a running Codex needs a restart. Codex's default sandbox lets a task write only inside its workspace and temporary folders, so an agent writing ~/.lastping/setup-codex.sh asks for your approval; the script itself is yours to run, with Codex's ! prefix or, if that is refused, in a terminal. ~/.codex/config.toml now holds the key: if you keep it in a dotfiles repository, keep that file out of git. The hooks and set-up scripts are POSIX sh: on Windows, run them in WSL or Git Bash. They are untested on Windows.
- Gemini CLI
- Gemini CLI cannot send a header, so the endpoint is this monitor's own URL, and that URL is a credential: anyone who has it can send pings and telemetry to this monitor. Keep it out of every repository, which is why the set-up writes the settings in your home directory; if you use a project .gemini/settings.json instead, make sure it is git ignored. otlpProtocol must stay "http": LastPing accepts OTLP over HTTP only. Gemini CLI sends no provider name, so its model calls show the model without a provider.
- Antigravity CLI
- Antigravity CLI exports no telemetry itself, so LastPing's hook script sends the runs and spans. It cannot report token counts or cost, because Antigravity does not expose them; span timing is approximate (hooks fire after the fact, one-second resolution); a run is never marked blocked; and it covers one Antigravity monitor per machine.
- Cursor
- Cursor itself exports no traces on any plan. Its own export (Enterprise plan only) sends metrics and logs in protobuf from Cursor's servers to one team endpoint, with a fixed resource set and no monitor id, so this set-up uses the hook runner instead, which works on every plan. The runner needs Python 3.12 or later. The runner is opentelemetry-hooks 0.14.0, pinned, published by o11y-dev (github.com/o11y-dev/opentelemetry-hooks), an independent project that is not part of Cursor, OpenTelemetry or LastPing.
- Python agent
- OTEL_EXPORTER_OTLP_PROTOCOL=http/protobuf is required: the distro otherwise picks the other OTLP protocol, which is not installed and which LastPing cannot accept, and exports nothing. Model spans come from the OpenAI and Anthropic instrumentations above; another LLM library needs its own instrumentation package. Replace python agent.py with however you start the agent.
- Node agent
- Needs Node 20.6 or later. Use the --require line for CommonJS and the --import line for an ES module project ("type": "module" in package.json, or .mjs files); the --require line alone patches nothing in an ES module. The OpenAI instrumentation covers the openai package up to major version 6. The Vercel AI SDK sends spans only after a code change: install @ai-sdk/otel and call registerTelemetry(new OpenTelemetry()) once at start-up.
- Any OpenTelemetry SDK
- Use the base endpoint variable exactly as written: the exporter adds /v1/traces itself. LastPing accepts OTLP over HTTP (protobuf or JSON) only.
- An OpenTelemetry Collector
- The key is bound to this monitor, so everything this exporter forwards is attributed to it; use one exporter and one key per monitor. Replace otelcol --config otelcol-config.yaml with however you start the collector; under systemd, EnvironmentFile= reads .env as written. With docker, use the docker line: it reads the key from .env in the shell and passes it with -e LASTPING_TRACING_KEY, by name only. Never use docker's --env-file with this .env: docker keeps the quotes, the key arrives with them, and every export is refused with 401. The docker line publishes the receiver ports 4317 and 4318 so programs on this machine can reach the collector; inside a container its otlp receiver must listen on 0.0.0.0 (endpoint: 0.0.0.0:4318 under receivers.otlp.protocols.http, and 0.0.0.0:4317 for grpc), because a receiver bound to localhost answers only inside the container.
7. Safety
A tracing key lives in a dotfile, so it can do almost nothing. Prompt and command content is not stored unless you ask for it.
The tracing key
A tracing key is a LastPing API key with the ingest scope, bound to one monitor. It can send pings,
traces, metrics and logs for that monitor and nothing else: every REST API route refuses it, so it cannot read
or change anything in the account. Its plaintext is shown once, when it is created. Mint one:
- on the monitor's Connect page in the console, which then shows one line to run in your own terminal: it asks for the key at a hidden prompt, so the key never enters a chat. This is the way for your own machine;
- over MCP with
create_ingest_key, for automation that stores the key itself, such as a CI secret. The key is returned into the conversation; - over REST with
POST /api/v1/checks/{id}/ingest-keys. Awritekey may call it, because what it mints is weaker than the caller.
Keep it in a git ignored file or the file the set-up stores it in, never in committed code. A
write or admin key is accepted at ingest too, but it can do far more than send
telemetry, so do not put one in an exporter's config. Gemini CLI takes no key at all: its URL is the credential.
Prompts and commands are not stored by default
Every monitor starts with trace_content set to "dropped": prompt text, completions,
commands, file paths, and tool arguments and results are removed at ingest, before anything is queued or
stored. For a log record, its free-text body goes too.
A monitor's owner can turn on Store prompts and commands (trace_content
"redacted"). The content is then stored, with every secret-shaped value redacted at ingest, before
it is queued. There is no setting that stores content unredacted, and no set-up step ever turns this on.
Secret-shaped values are redacted either way, in every string LastPing keeps. They include private keys, JSON
web tokens, webhook URLs, API keys and tokens from the common providers (LastPing's own, Anthropic, OpenAI,
GitHub, AWS, Slack, Stripe, Google and more), authorization headers, credentials inside URLs, passwords on
command lines and in SQL, Vault tokens, cookies, values assigned to names such as password or
token, and long high-entropy strings. A redacted value is replaced with
[REDACTED:<class>], and a span that lost one says so.
Error text is kept either way, because it says why a call failed. By default it is redacted and then cut to 512 characters. With content stored, the 512-character cut does not apply; secret-shaped values are still redacted.
Daily budgets
Each project may store 2,000,000 spans a day (UTC), and metric data points and log records count against the
same budget. Inside it, at most 200,000 of them may be log events. The Agents page shows how much of today's
budget is used. At the limit an export is refused with 429 and SPAN_BUDGET_EXCEEDED
(or LOG_EVENT_BUDGET_EXCEEDED for log events), with a Retry-After that runs to
00:00 UTC, so a runaway agent cannot fill the database.
How long each kind of data is kept is in 8. Limits and, in full, on the privacy page.
8. Limits
OTLP over HTTP only, protobuf or JSON, gzip accepted, at https://ping.lastping.dev. gRPC is not
accepted.
| Limit | Value | Past it |
|---|---|---|
| Request body | 1 MB (1 MiB), measured after gzip is decompressed | 413 |
| Items per request | 500 spans, or 500 metric data points, or 500 log records | 400 |
| Spans per run | 2,000. With no run id every trace is its own run, so that is 2,000 spans per trace | The rest are dropped and counted as dropped on the run |
| Requests per hour | 3,600 per project, counted separately for traces, metrics and logs | 429, Retry-After: 60 |
| Spans per day | 2,000,000 per project per UTC day, metric data points and log records included | 429 SPAN_BUDGET_EXCEEDED, retry after 00:00 UTC |
| Log events per day | 200,000 per project per UTC day, inside the span budget | 429 LOG_EVENT_BUDGET_EXCEEDED, retry after 00:00 UTC |
| A busy ingest host | When the host is already handling as many exports as it can | 429 OTLP_BUSY, Retry-After: 5, before the body is read |
| Span names | 256 bytes | Cut, not refused |
| Attributes | 32 KiB per span | Cut, not refused; model, provider, token and cost keys are kept first |
| Clock skew | A span may start at most one hour after it arrived | Dropped, and counted in the 202 response |
Retention
| Data | Kept |
|---|---|
| Spans, and prompt and command content when stored | 30 days |
| Agent log events | 30 days |
| A run's summary totals (span count, tokens, cost) | 90 days |
| Dependency and usage aggregates, and each project's daily span count | 90 days |
| Discovered trace sources | 90 days after last seen, unless adopted |
| Ingest diagnostics | 7 days |
Everything here is pruned nightly. See the privacy page for every kind of data LastPing keeps.