Free for individuals
For everything that fails by going quiet.
The AI agent that stopped mid-task, the cron that ran but didn't finish, the pipeline that hung at the last step. Your job pings in; if it goes silent, LastPing opens an incident and pages you before your users notice.
Free for individuals, fully hosted, first alert in under two minutes.
Three monitor types, one engine
Each one uses the same durable detection engine and alert pipeline. AI agents report through the same pings.
Heartbeat and cron
Your job calls a URL when it finishes. Silence opens an incident.
CI/CD signals
A signed webhook from GitHub Actions, GitLab CI or Jenkins.
HTTP uptime
LastPing probes your URL for status code, latency and a keyword.
AI agents, on heartbeats
Start, success, fail and blocked, plus progress steps within a run.
An agent can set up its own monitoring
Point one at mcp.lastping.dev and it creates its own monitor, instruments itself and reports as it works. A hosted MCP server with 50 tools, plus a standalone binary at full tool parity.
- It calls
register_agentandcreate_monitor, no console visit required. - Blocked: it stopped mid-task waiting on a person, and you hear about it.
- Silence between runs: a silence floor (
expect_every_s) catches an agent that stops reporting altogether. - Looping or running away: a metric guard caps a number it reports about itself.
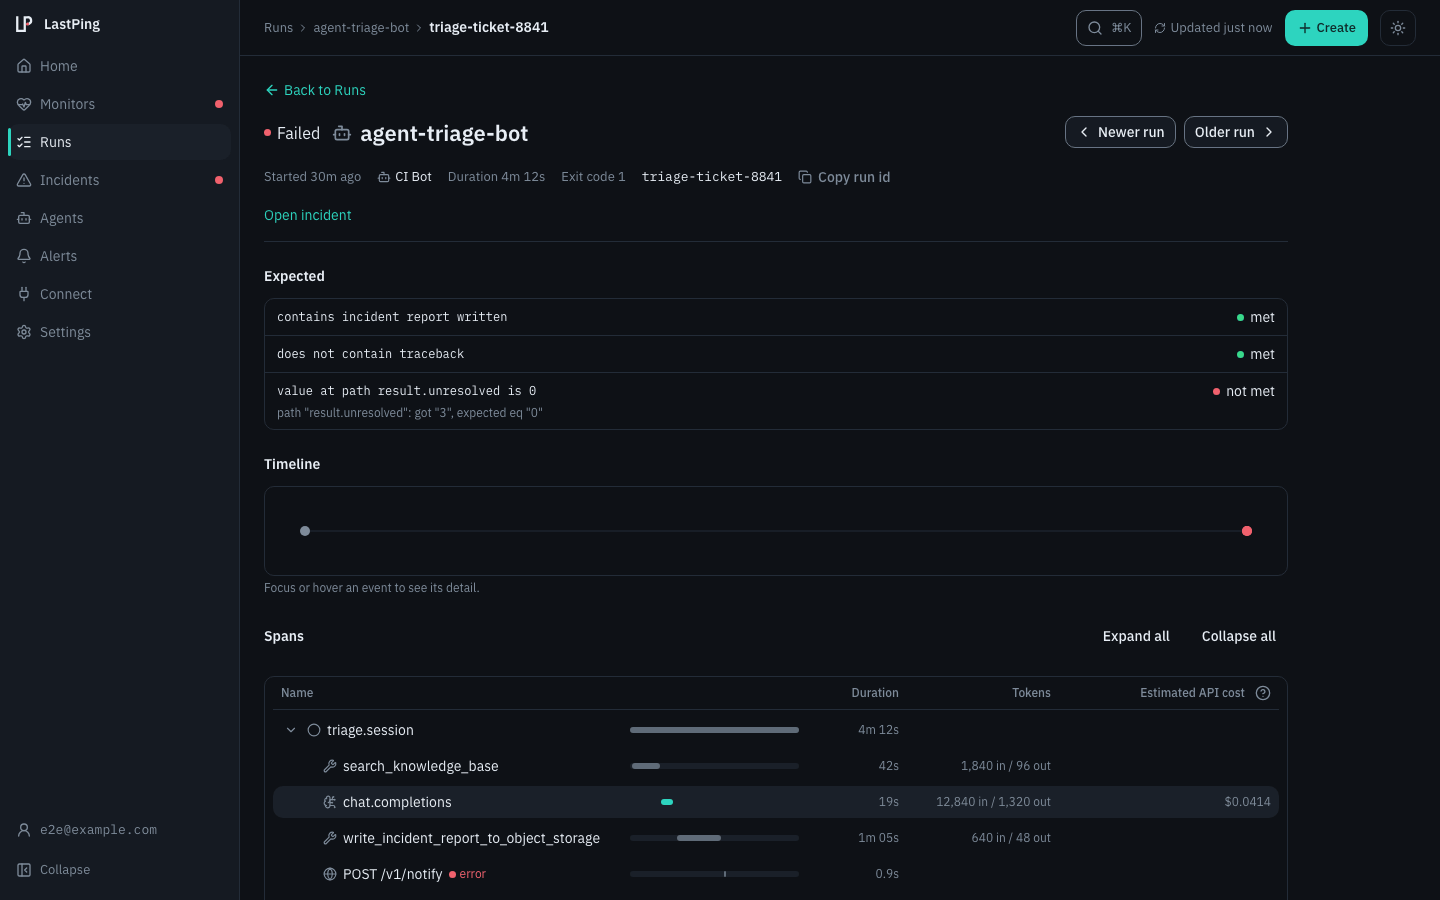
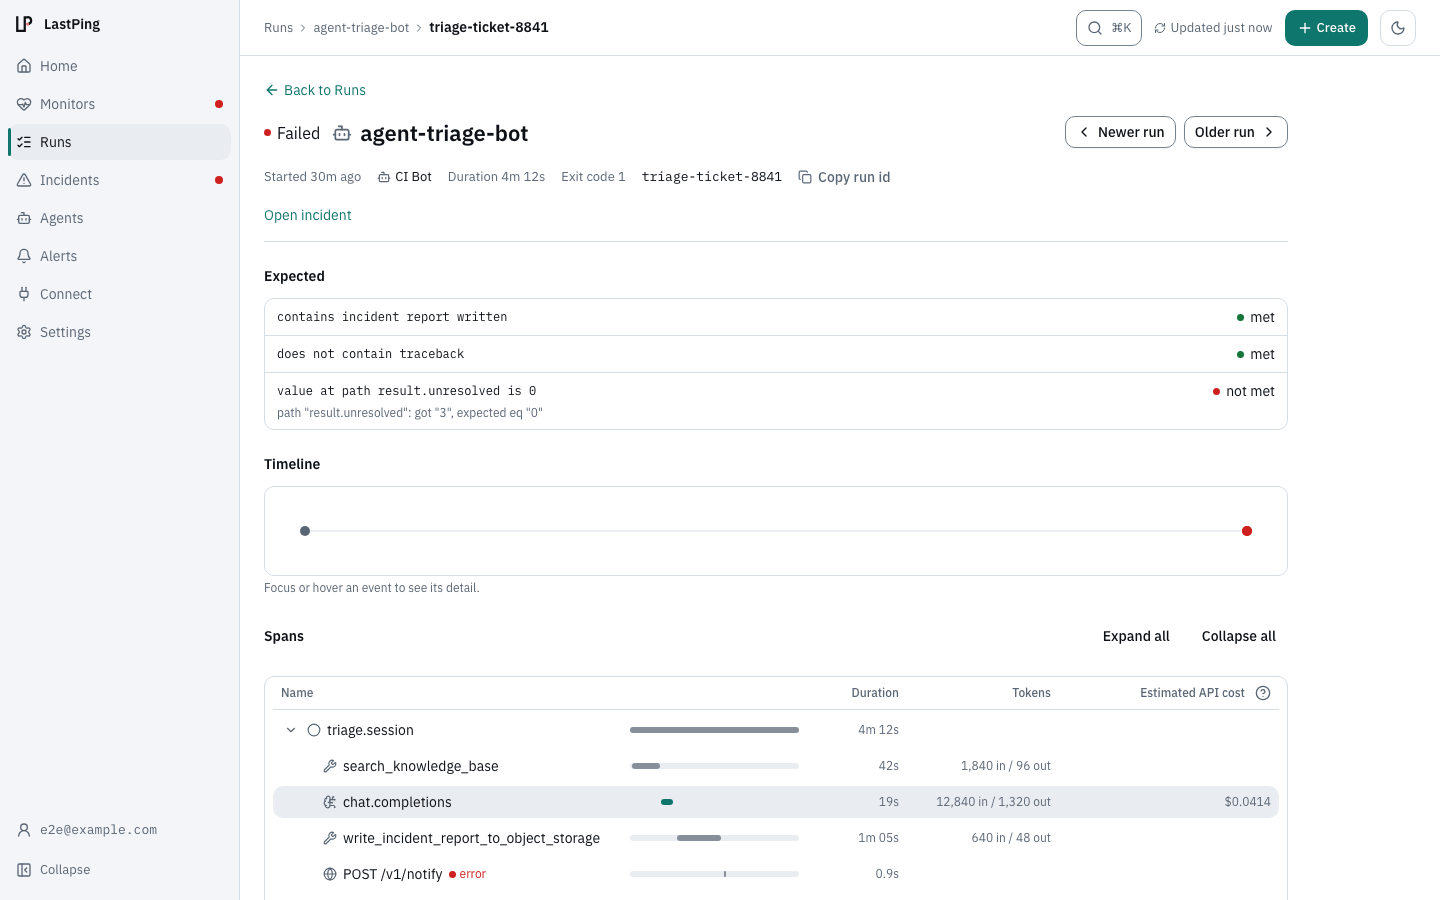
- Finished, achieved nothing: an output assertion fails the run anyway.
Heartbeat and cron: a dead man's switch
Add one curl to the end of your job, set the expected period and a grace window. No library, any language.
up,late,downon durable database deadlines: a restart or redeploy never misses a due check.- Optional run budget (
max_runtime_s) and progress budget (step_timeout_s) for long multi-stage jobs. - Exited zero having done nothing? An output assertion fails the run and opens an incident.
- On recovery the incident closes and a recovery alert fires.
# end of your cron job
curl -fsS https://ping.lastping.dev/<id>
RID=$(uuidgen)
curl -fsS "https://ping.lastping.dev/<id>/start?rid=$RID"
curl -fsS "https://ping.lastping.dev/<id>/step?rid=$RID&step=extract"
curl -fsS "https://ping.lastping.dev/<id>?rid=$RID"CI/CD: pipeline visibility via signed webhooks
GitHub Actions, GitLab CI and Jenkins (webhook plugin) send a signed webhook when a job starts and when it finishes. Zero YAML config on the LastPing side.
- Alerts on failure, on silence (started, never reported back), on consecutive-failure streaks, and on recovery.
- Payloads are HMAC-signed; LastPing verifies before processing.
- The alert deep-links to the exact run: one click to the log.
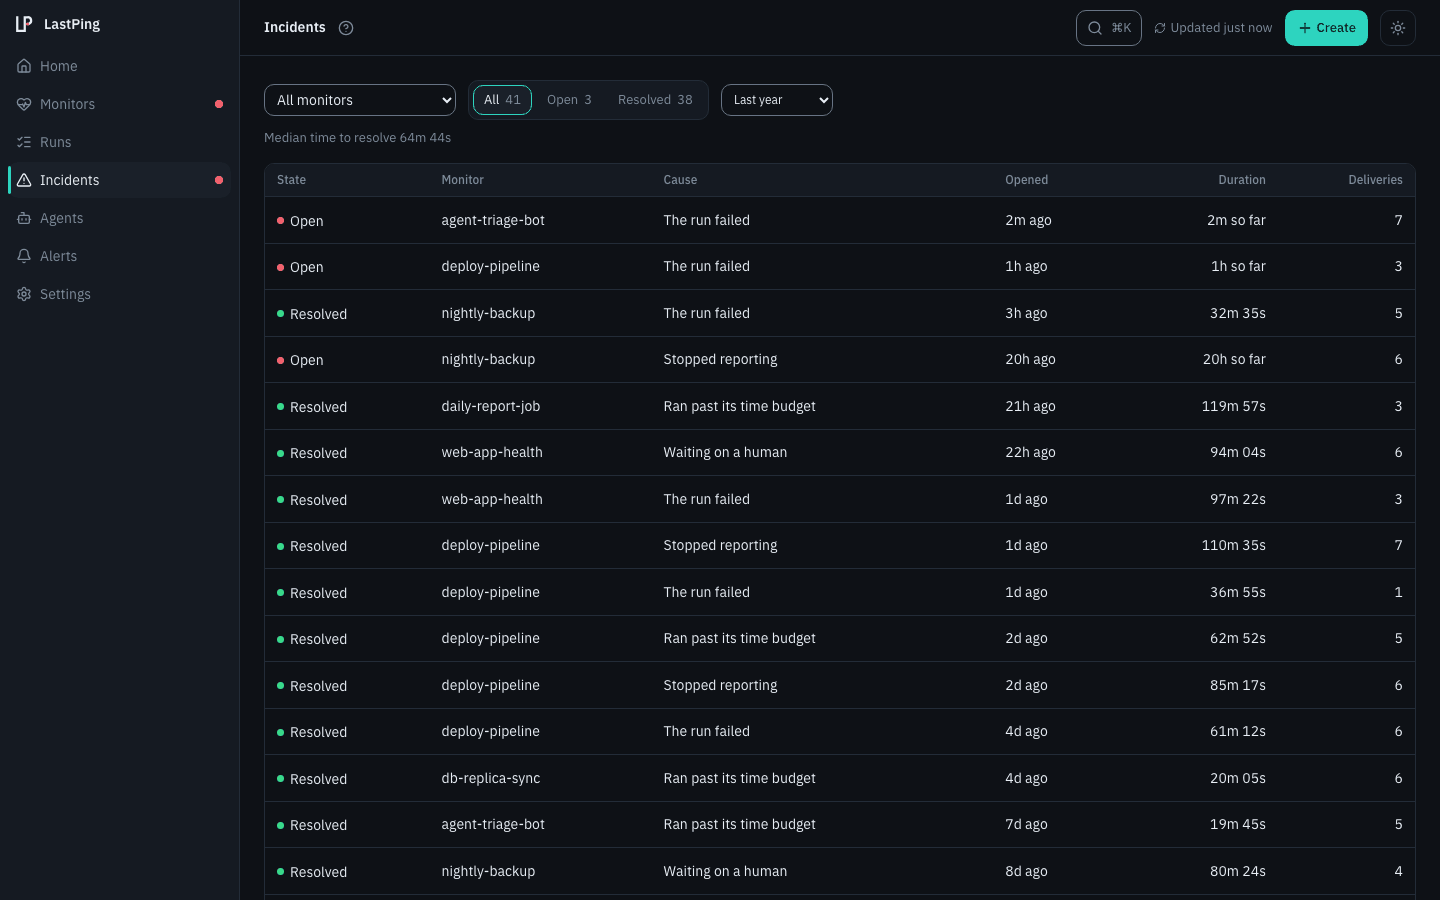
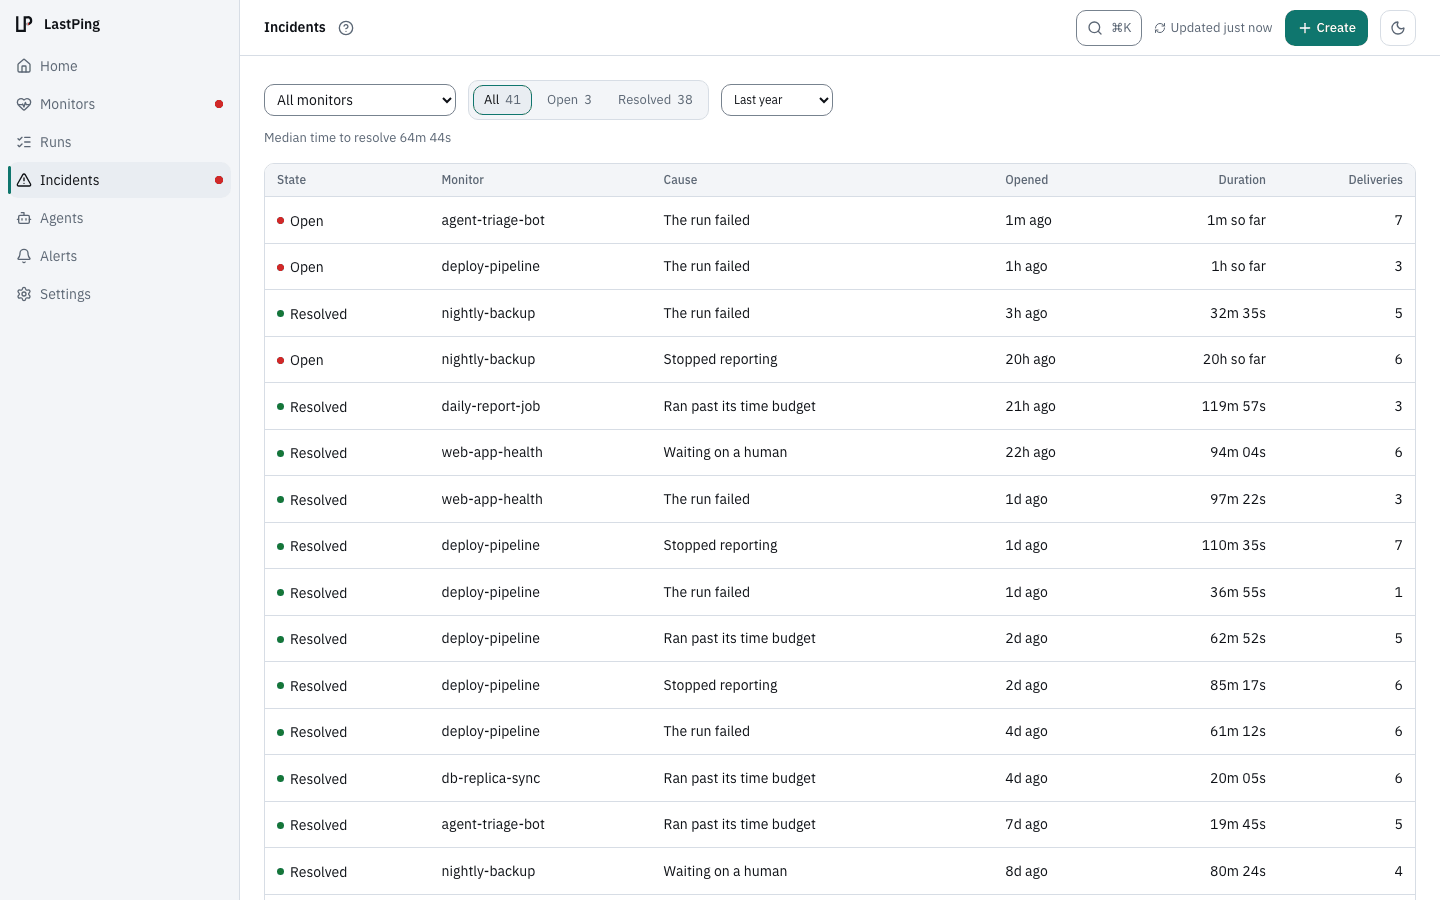
HTTP uptime: LastPing probes your URL
Give LastPing a URL, no agent to install on your server. It checks status code, latency and keyword presence on your interval.
- Catches non-2xx or timeout, latency spikes, a missing keyword, TLS failures and DNS failures.
- SSRF-guarded: probes never reach private IP ranges or cloud-metadata endpoints.
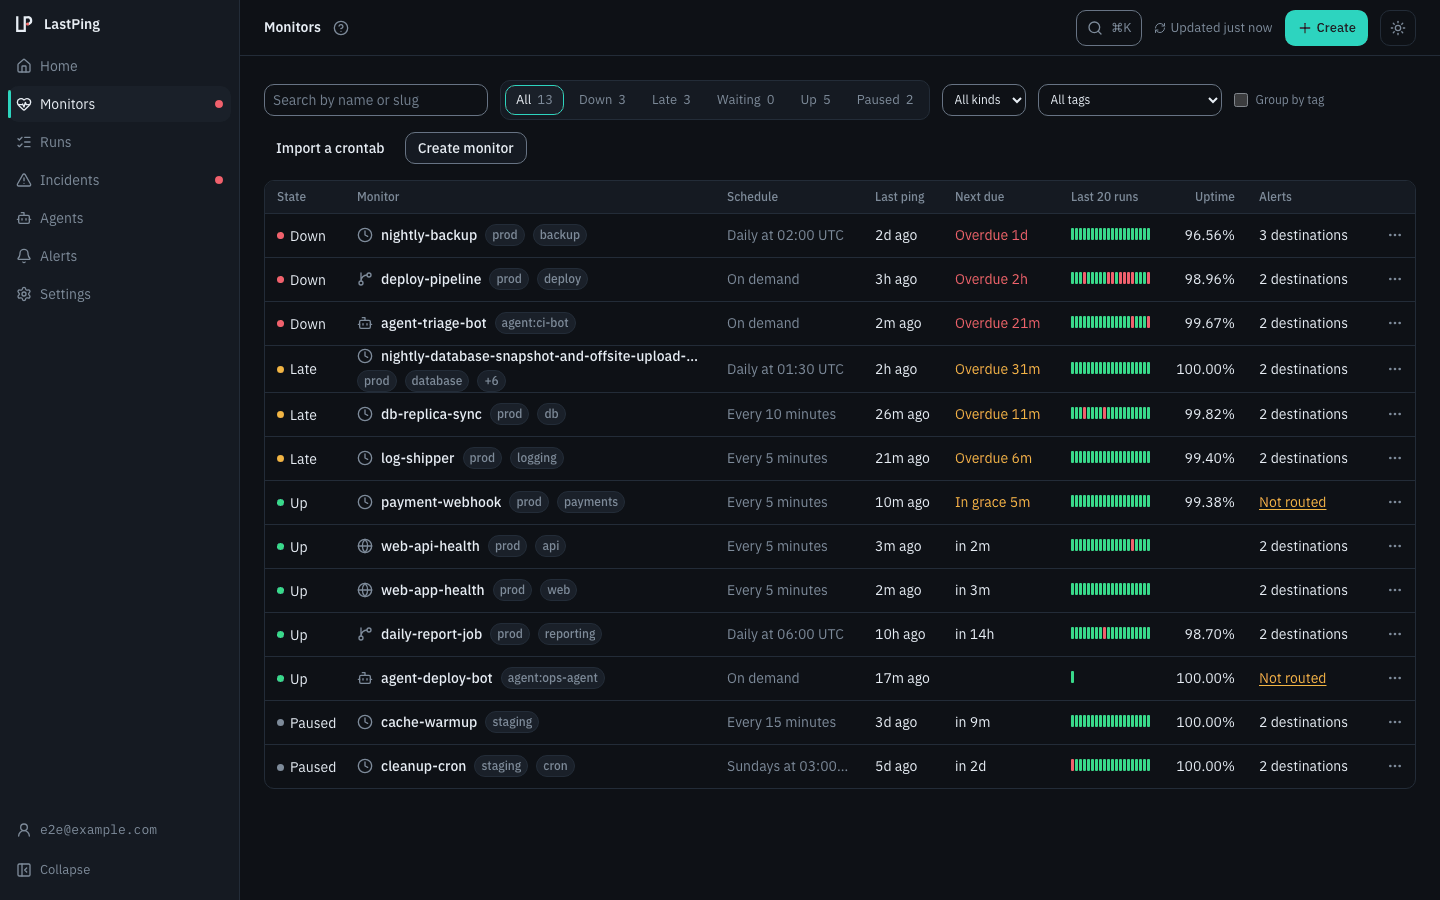
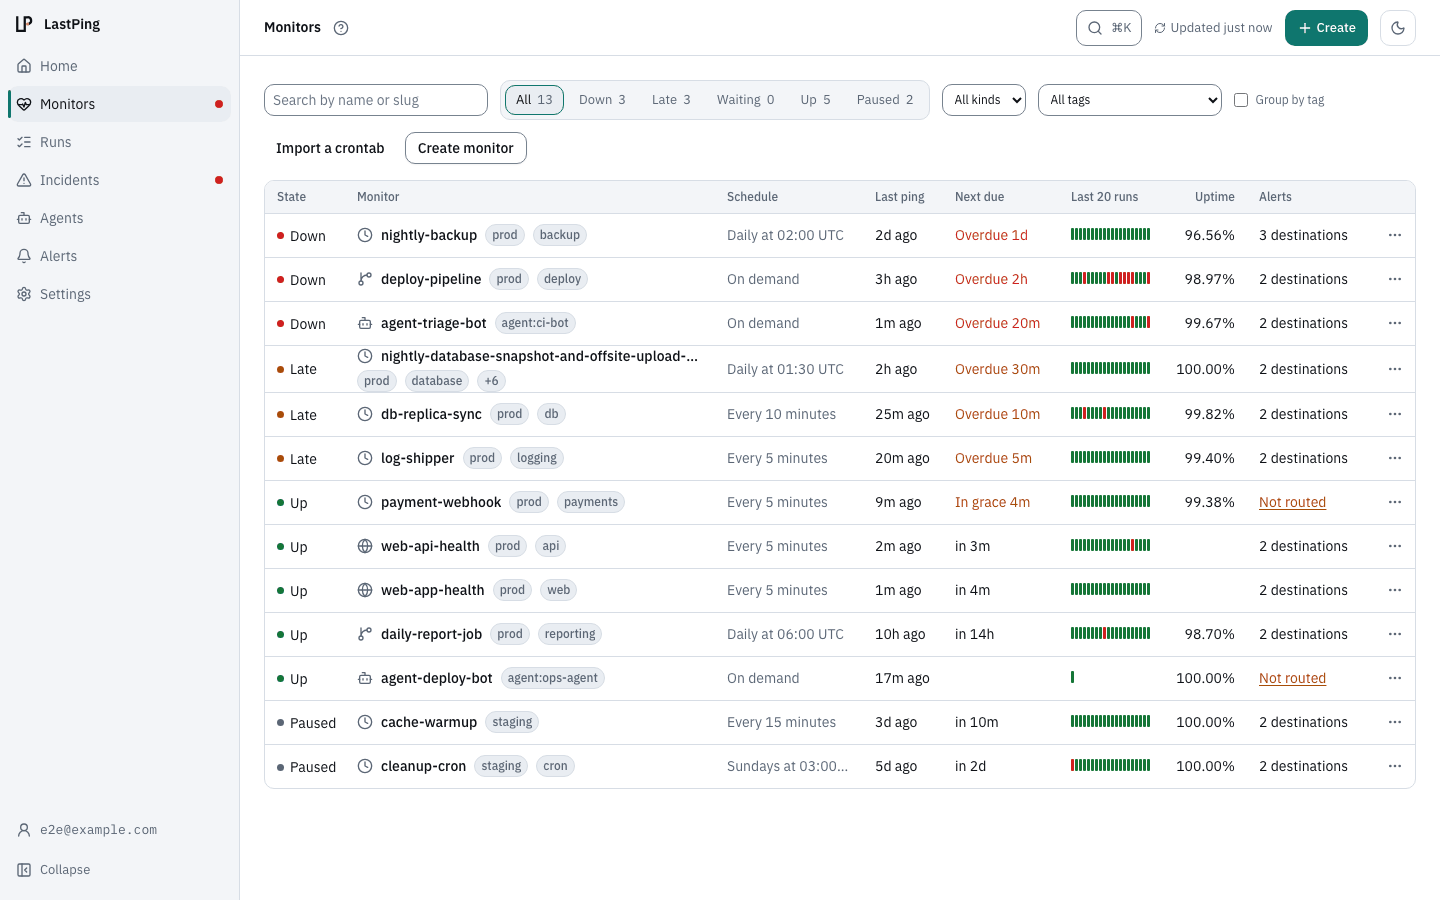
Route the right signal to the right channel
Nine delivery channels, a routing matrix per monitor, custom message templates, and flap damping so you only get paged when it matters.
emailSlackDiscordTelegramwebhookMicrosoft TeamsGoogle ChatPushoverntfy
- Email is the default: it fires on the very first check, no config needed.
- Templates take variables such as
{check_name},{status}and{run_url}, with a live preview, per event type. - A blip that recovers within a short window is held and cancelled. Per-channel rate caps suppress duplicates.
| Channel | Down | Fail | Blocked | Recover |
|---|---|---|---|---|
| yes | yes | yes | no | |
| slack | yes | yes | yes | yes |
| telegram | yes | no | yes | no |
| pushover | yes | no | no | no |
| webhook | yes | yes | yes | yes |
Illustrative. Every one of the nine destinations gets its own row. Blocked fires when an agent stops mid-task waiting on a person. started, success, every-run and note are routable too, never by default.
Four ways in, each for what it is good at.
Monitors, destinations, routing and status pages are on all four.
Web console
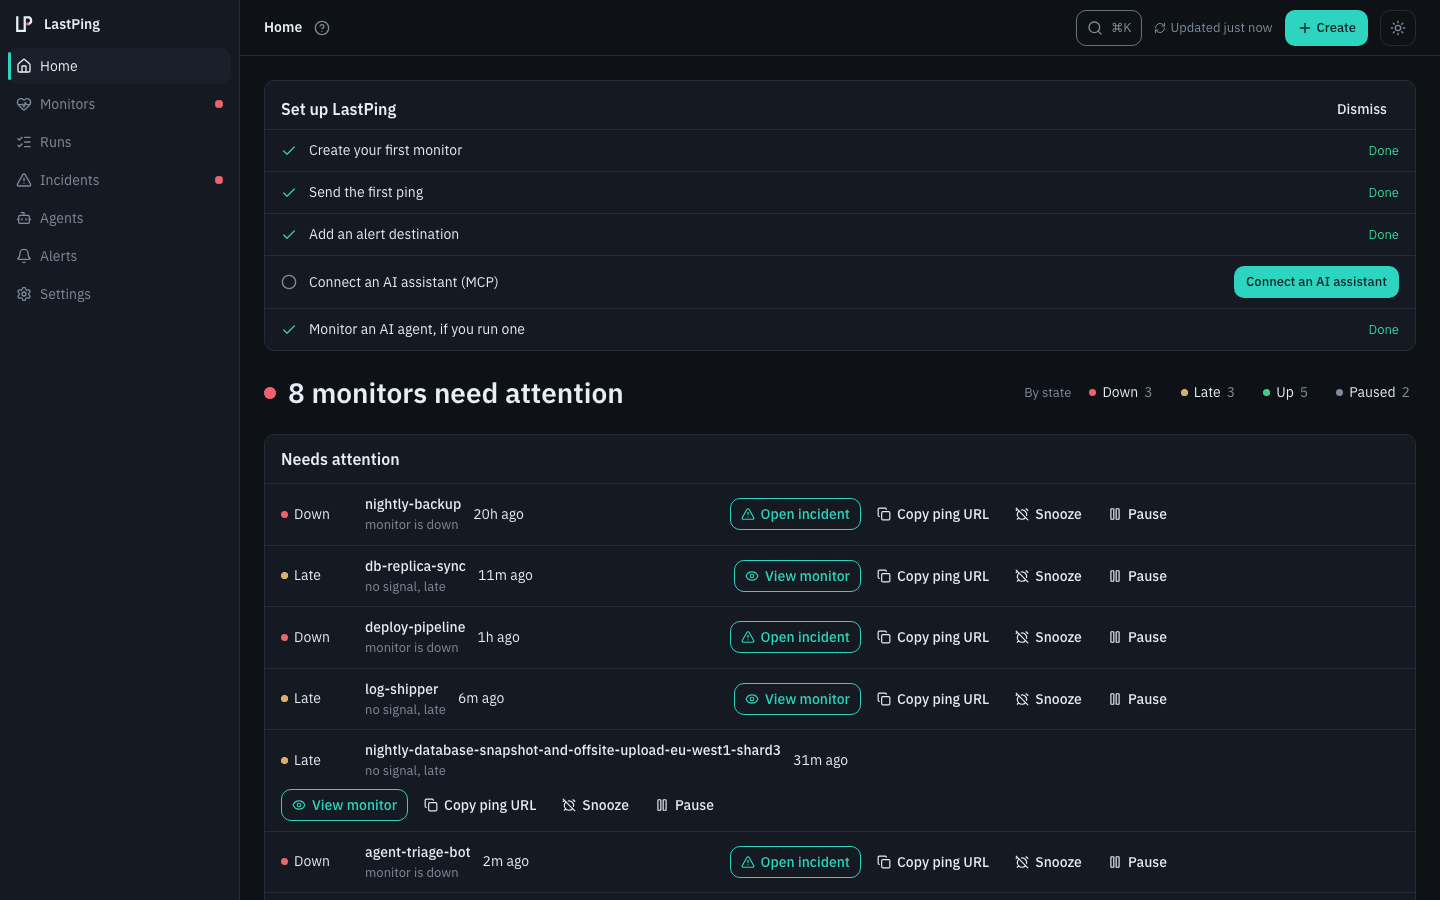
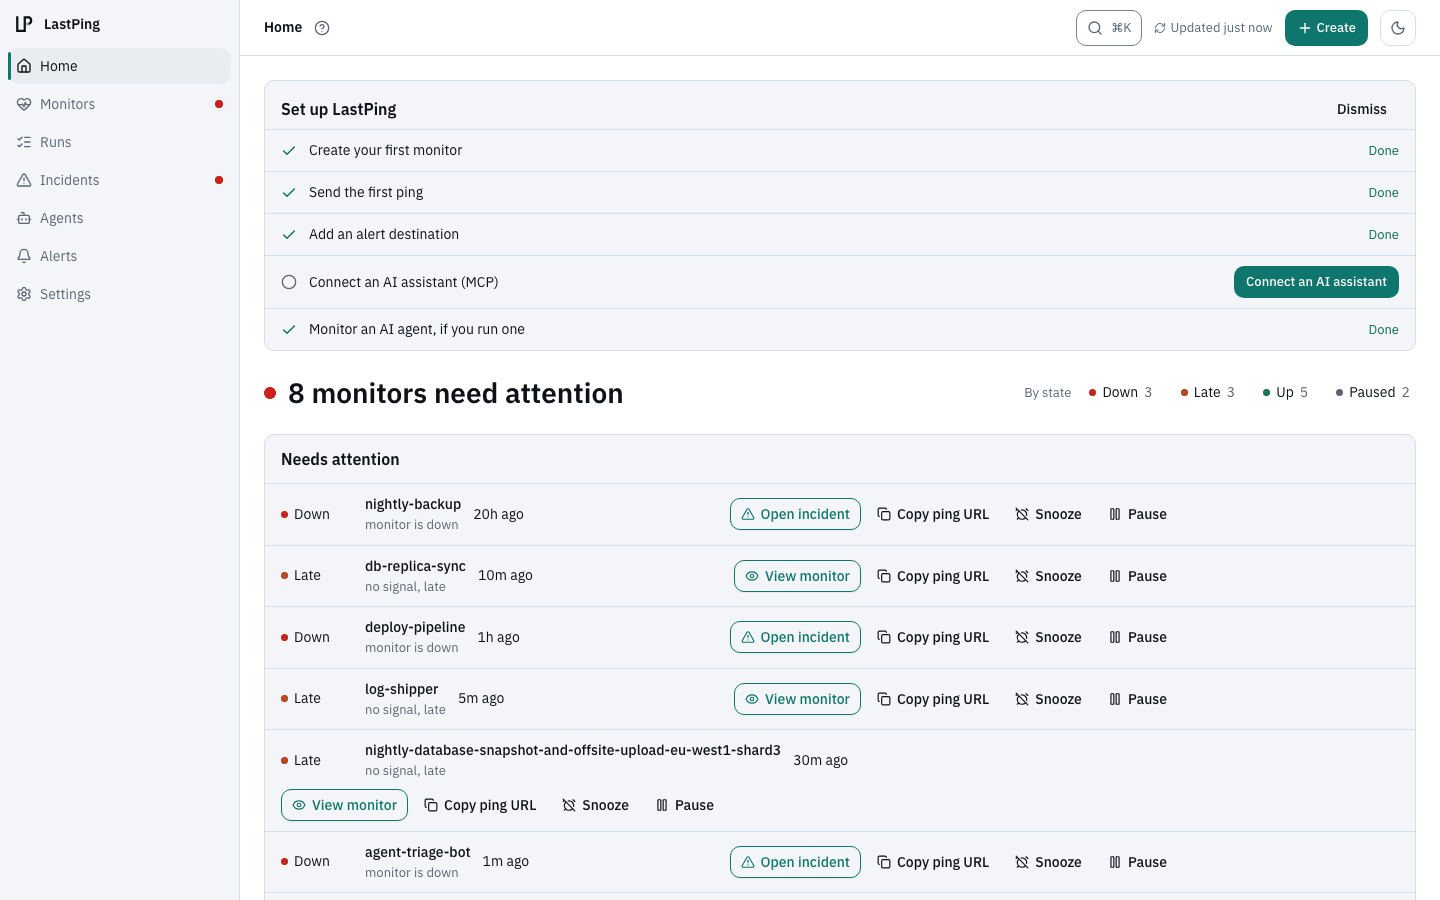
Home shows what needs you now. Light and dark themes, and a command palette.
REST API
A published OpenAPI document, partial PATCH, and a Prometheus /metrics endpoint per project.
MCP
What an agent would do or ask, from creating a monitor to reading a failed run.
Terraform
Declarative configuration in version control: lastping-dev/lastping.
Public status pages, no extra service needed
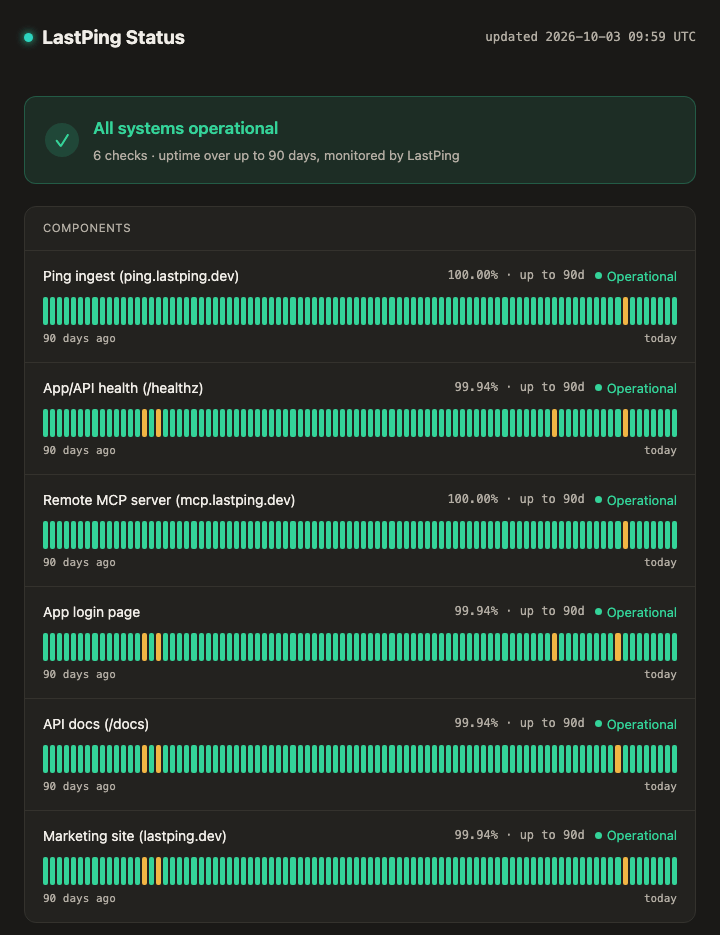
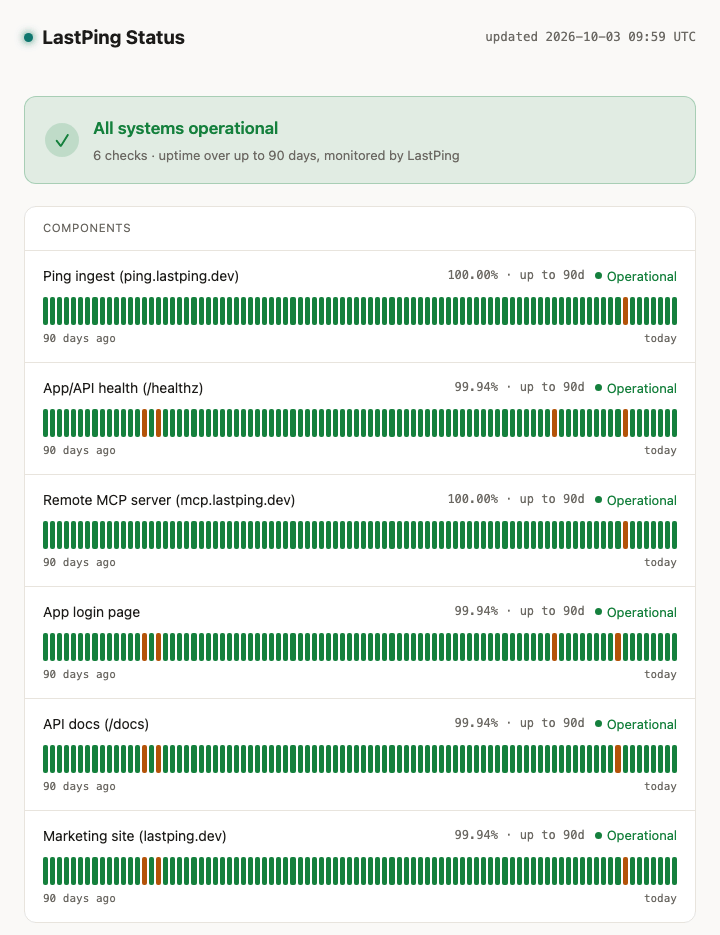
Backed by the same monitors that already power your alerts, with no duplicate configuration.
- A public status URL per project, with no separate hosting and no additional cost.
- A live, embeddable badge for any README or docs page.
- You choose which monitors show; internal cron jobs can stay private.
Start monitoring in minutes
Free for individuals. One URL to ping, or let your AI assistant set it up.