Built in public
LastPing monitors LastPing.
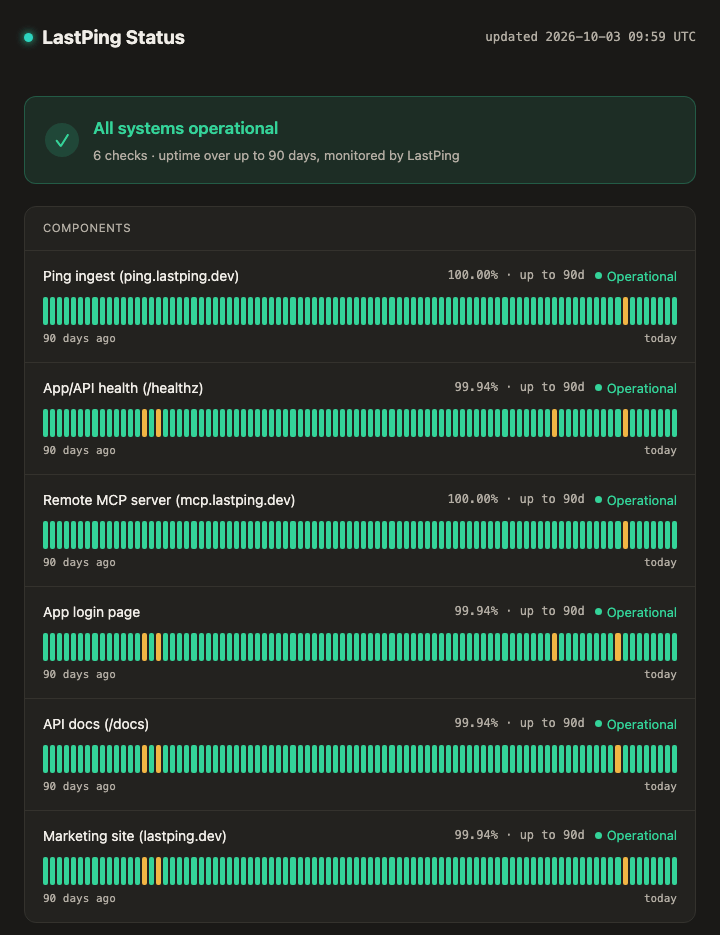
Six ordinary HTTP checks, the same kind any customer creates, watch LastPing's own ping ingest, app, MCP server, login, docs and marketing site around the clock. The results, uptime history and all, are public.


Six HTTP probes watch the ping ingest endpoint, the app health endpoint, the MCP server, the login page, the docs, and the marketing site.
Why we do this
LastPing's whole pitch is that silence is the failure you can't see. That applies to us hardest of all: if LastPing's own detection or alerting broke quietly, every user's monitoring would break quietly too.
- LastPing's own endpoints are monitored by LastPing itself, in an ordinary account.
- Alerts page the builder on Discord and email, like any other user's would.
- The current state, incidents included, is on a public status page served by the same status-page feature you can use.
What this does, and doesn't, prove
Six checks, watched the same way a customer would watch them.
Ordinary HTTP checks, same account
Created through LastPing's dashboard and public REST API. No internal-only tooling, no elevated access.
Incidents shown, not hidden
On 22 July, four of these components missed their check window and recovered within minutes. That incident is still on the status page.
It proves the HTTP path, end to end
Probing, alerting and the public status page run continuously on real infrastructure.
It doesn't prove heartbeat detection
These six are HTTP probes. They don't exercise the absence-detection path that catches a job that silently stops running.
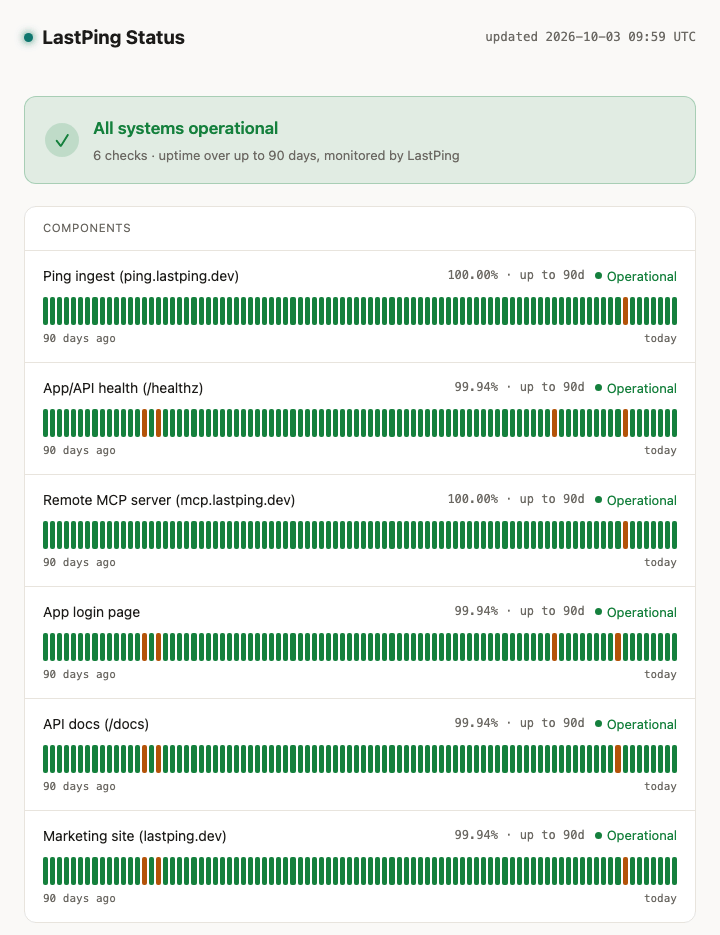
Nothing here is rendered specially for marketing: the console above mirrors what the live status page shows, incident history included.
Questions people ask
Does LastPing monitor itself?
Yes. Six ordinary HTTP monitors, the same kind any LastPing customer creates, watch LastPing's own ping ingest endpoint, the app's health endpoint, the MCP server, the login page, the docs, and the marketing site. Alerts route to Discord and email, and the results, including 90 days of uptime history, are on a public status page.
What does this prove, and what doesn't it?
It proves the HTTP probing path, alerting, and the public status page work continuously on real infrastructure, including catching a four-component incident on 22 July that's still shown on the page rather than removed. It doesn't exercise heartbeat or absence detection, the mechanism LastPing uses to catch a job that stops running silently, because these six checks are ordinary HTTP probes, not heartbeats.
Does this use special internal access?
No. These monitors, alert routes, and the status page are ordinary objects in a LastPing account, created and read through the same public REST API and dashboard every customer uses: no internal-only tooling, no privileged access.
Start monitoring in minutes
Free for individuals. One URL to ping, or let your AI assistant set it up.